See also
This notebook can be downloaded here
UML class diagram generator#
This notebook generates UML diagrams of class hierarchies
Dependencies:
pylint,ipykernel(install these two in a python env), graphviz
from IPython.display import Image, display
from quantify_scheduler.helpers.inspect import make_uml_diagram
General notes#
Yellow labels indicate addition as a submodule
Different colors indicate different packages
Generated figures are saved in png format
Options must be given in
list[str]formatFor more information, visit the Wikipedia page on relationships in class diagrams
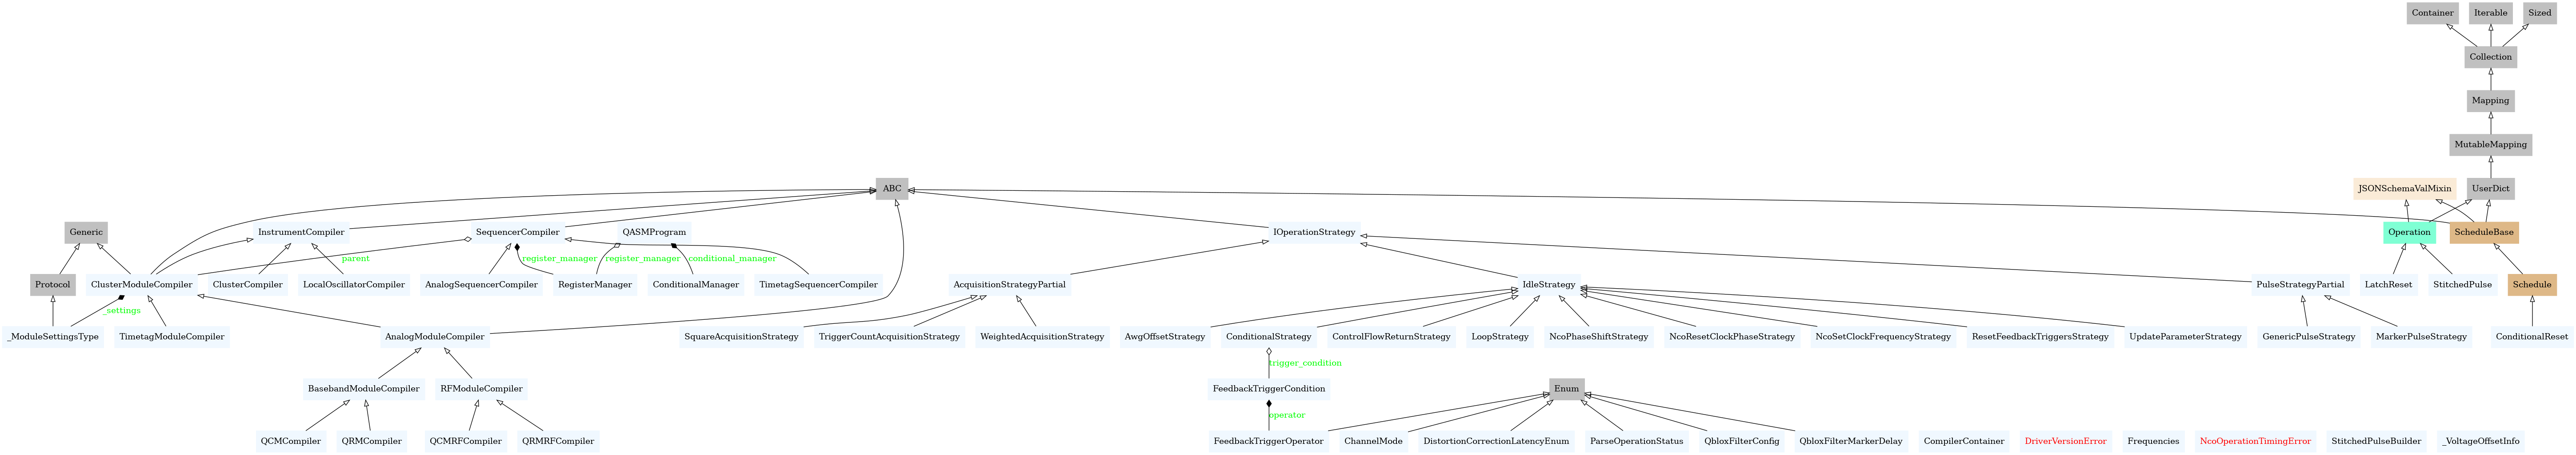
Plotting all classes in a module#
Be aware that this option will only plot classes that are contained within
module_to_plot, and not related classes defined outside the module.Extra options:
Show ancestors (aka parent classes):
-AIgnore specific submodules:
--ignore <file[,file...]>(e.g.["--ignore", "circuit_to_device.py,corrections.py,zhinst"])
from quantify_scheduler.backends import qblox

module_to_plot = qblox
options = ["-A"]

diagram_name = make_uml_diagram(module_to_plot, options)
if diagram_name:
    display(Image(diagram_name))
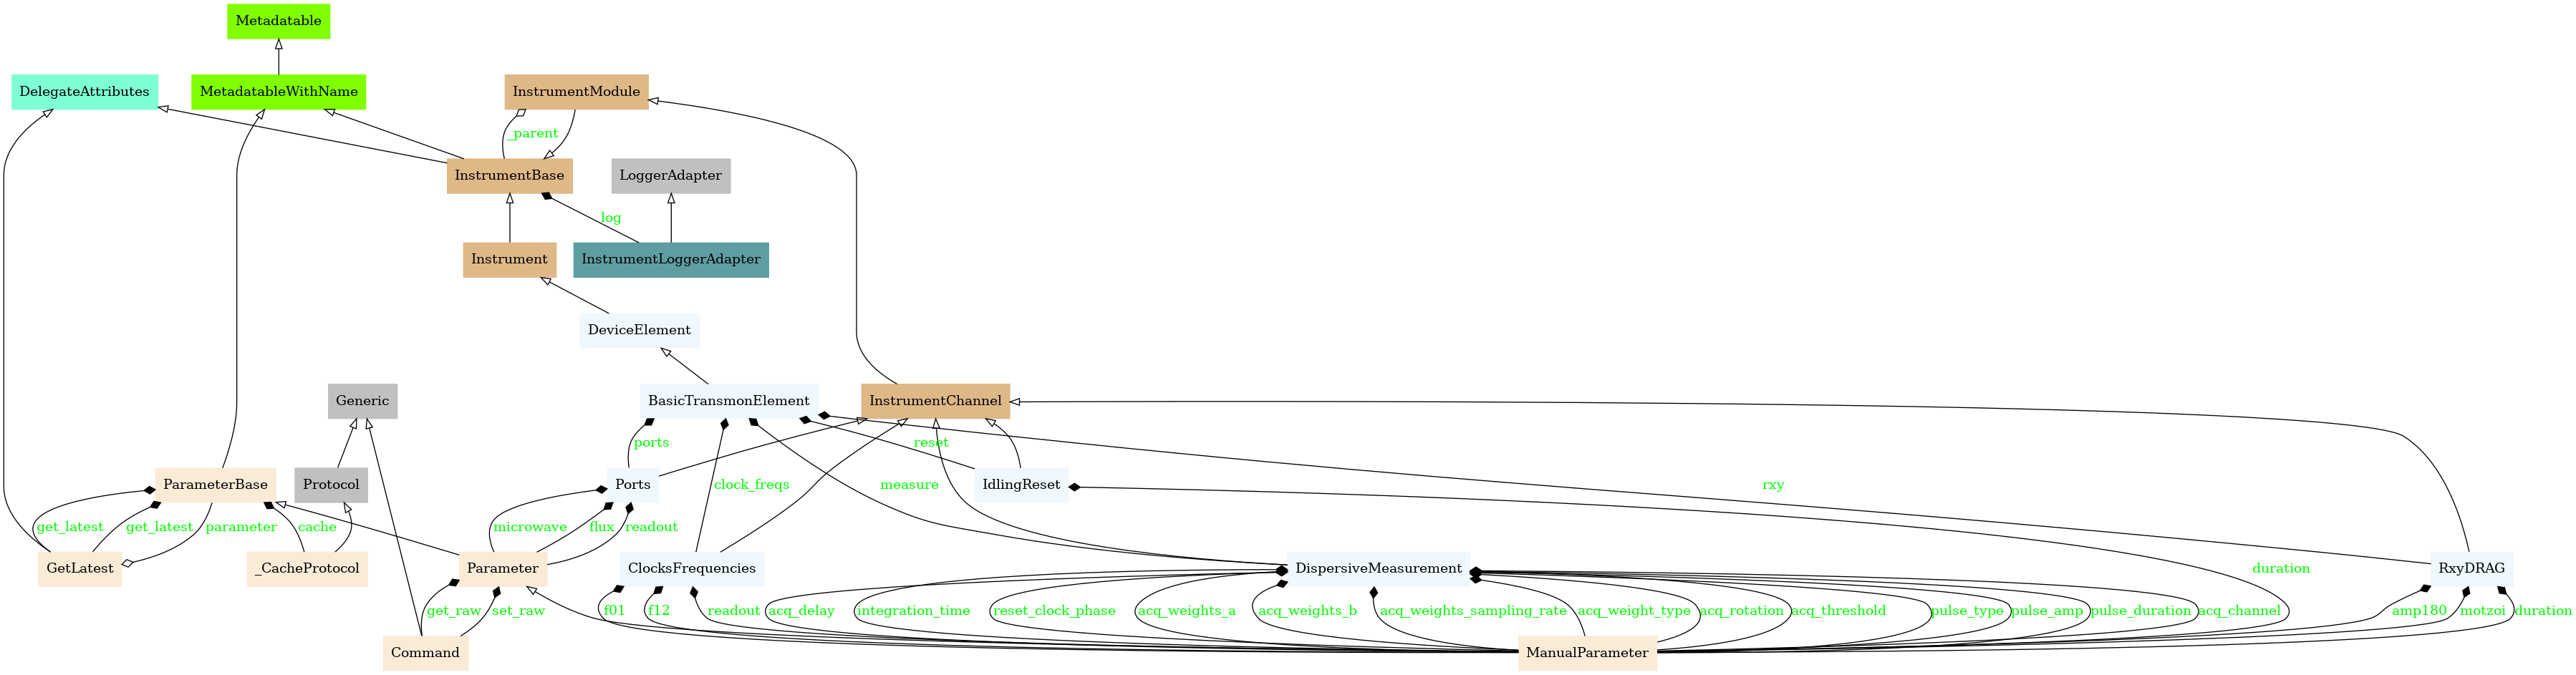
Plotting ancestors and submodules of a class#
Remove
--only-classnamesoption to show all class attributes
from quantify_scheduler.device_under_test.transmon_element import BasicTransmonElement

class_to_plot = BasicTransmonElement
options = ["--only-classnames"]

diagram_name = make_uml_diagram(class_to_plot, options)
if diagram_name:
    display(Image(diagram_name))