quantify_scheduler.visualization.circuit_diagram
Plotting functions used in the visualization backend of the sequencer.
Module Contents
Functions
|
A box for a single gate containing a label. |
|
Adds a visual indicator for a Baseband pulse to the mathplotlib.axes.Axis |
|
Adds a visual indicator for a Modulated pulse to the mathplotlib.axes.Axis |
|
A simple meter to depict a measurement. |
|
Variation of the meter to depict a acquisition. |
|
Same as acq_meter, but also displays text. |
|
Markers to denote a CNOT gate between two qubits. |
|
Markers to denote a CZ gate between two qubits. |
|
A broken line to denote qubit initialization. |
|
Returns the name of a qubit in a pulse address. |
Creates a circuit diagram visualization of a schedule using matplotlib. |
- gate_box(ax: matplotlib.axes.Axes, time: float, qubit_idxs: List[int], text: str, **kw)[source]
A box for a single gate containing a label.
- Parameters
ax –
time –
qubit_idxs –
text –
- pulse_baseband(ax: matplotlib.axes.Axes, time: float, qubit_idxs: List[int], text: str, **kw)[source]
Adds a visual indicator for a Baseband pulse to the mathplotlib.axes.Axis instance.
- Parameters
ax –
time –
qubit_idxs –
text –
- pulse_modulated(ax: matplotlib.axes.Axes, time: float, qubit_idxs: List[int], text: str, **kw)[source]
Adds a visual indicator for a Modulated pulse to the mathplotlib.axes.Axis instance.
- Parameters
ax –
time –
qubit_idxs –
text –
- meter(ax: matplotlib.axes.Axes, time: float, qubit_idxs: List[int], text: str, **kw)[source]
A simple meter to depict a measurement.
- Parameters
ax –
time –
qubit_idxs –
text –
- acq_meter(ax: matplotlib.axes.Axes, time: float, qubit_idxs: List[int], text: str, **kw)[source]
Variation of the meter to depict a acquisition.
- Parameters
ax –
time –
qubit_idxs –
text –
- acq_meter_text(ax: matplotlib.axes.Axes, time: float, qubit_idxs: List[int], text: str, **kw)[source]
Same as acq_meter, but also displays text.
- Parameters
ax –
time –
qubit_idxs –
text –
- cnot(ax: matplotlib.axes.Axes, time: float, qubit_idxs: List[int], text: str, **kw)[source]
Markers to denote a CNOT gate between two qubits.
- Parameters
ax –
time –
qubit_idxs –
text –
- cz(ax: matplotlib.axes.Axes, time: float, qubit_idxs: List[int], text: str, **kw)[source]
Markers to denote a CZ gate between two qubits.
- Parameters
ax –
time –
qubit_idxs –
text –
- reset(ax: matplotlib.axes.Axes, time: float, qubit_idxs: List[int], text: str, **kw)[source]
A broken line to denote qubit initialization.
- Parameters
ax – matplotlib axis object.
time – x position to draw the reset on
qubit_idxs – indices of the qubits that the reset is performed on.
text –
- _locate_qubit_in_address(qubit_map, address)[source]
Returns the name of a qubit in a pulse address.
- circuit_diagram_matplotlib(schedule: Schedule, figsize: Tuple[int, int] = None, ax: Optional[matplotlib.axes.Axes] = None) Tuple[matplotlib.figure.Figure, Union[matplotlib.axes.Axes, List[matplotlib.axes.Axes]]][source]
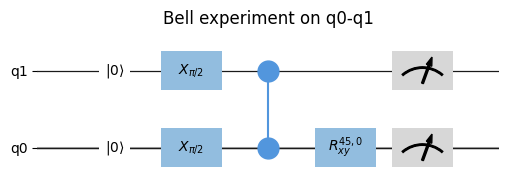
Creates a circuit diagram visualization of a schedule using matplotlib. Each gate, pulse, measurement, and operation are plotted in the order of execution, but the exact timing is not visible here.
Warning
This function is deprecated and will be removed after quantify-scheduler>=0.14. To plot a circuit diagram, please call
plot_circuit_diagram()fromScheduleBaseinstead.- Parameters
schedule – the schedule to render.
figsize – matplotlib figsize.
ax – Axis handle to use for plotting.
- Returns
fig – matplotlib figure object.
ax – matplotlib axis object.
Example
from quantify_scheduler import Schedule
from quantify_scheduler.operations.gate_library import Reset, X90, CZ, Rxy, Measure

sched = Schedule(f"Bell experiment on q0-q1")

sched.add(Reset("q0", "q1"))
sched.add(X90("q0"))
sched.add(X90("q1"), ref_pt="start", rel_time=0)
sched.add(CZ(qC="q0", qT="q1"))
sched.add(Rxy(theta=45, phi=0, qubit="q0") )
sched.add(Measure("q0", acq_index=0))
sched.add(Measure("q1", acq_index=0), ref_pt="start")

sched.plot_circuit_diagram();

Note
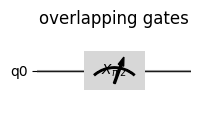
Gates that are started simultaneously on the same qubit will overlap.
from quantify_scheduler import Schedule
from quantify_scheduler.operations.gate_library import X90, Measure

sched = Schedule(f"overlapping gates")

sched.add(X90("q0"))
sched.add(Measure("q0"), ref_pt="start", rel_time=0)
sched.plot_circuit_diagram();

Note
If the pulse’s port address was not found then the pulse will be plotted on the ‘other’ timeline.