

Xarray - brief introduction#
The Quantify dataset is based on Xarray. This subsection is a very brief overview of some concepts and functionalities of xarray. Here we use only pure xarray concepts and terminology.
This is not intended as an extensive introduction to xarray. Please consult the xarray documentation if you never used it before (it has very neat features!).
There are different ways to create a new xarray dataset. Below we exemplify a few of them to showcase specific functionalities.
An xarray dataset has Dimensions and Variables. Variables “lie” along at least one dimension:
n = 5

values_pos = np.linspace(-5, 5, n)
dimensions_pos = ("position_x",)
# the "unit" and "long_name" are a convention for automatic plotting
attrs_pos = dict(unit="m", long_name="Position")  # attributes of this data variable

values_vel = np.linspace(0, 10, n)
dimensions_vel = ("velocity_x",)
attrs_vel = dict(unit="m/s", long_name="Velocity")

data_vars = dict(
    position=(dimensions_pos, values_pos, attrs_pos),
    velocity=(dimensions_vel, values_vel, attrs_vel),
)

dataset_attrs = dict(my_attribute_name="some meta information")

dataset = xr.Dataset(
    data_vars=data_vars,
    attrs=dataset_attrs,
)  # dataset attributes
dataset
<xarray.Dataset> Size: 80B
Dimensions:   (position_x: 5, velocity_x: 5)
Dimensions without coordinates: position_x, velocity_x
Data variables:
    position  (position_x) float64 40B -5.0 -2.5 0.0 2.5 5.0
    velocity  (velocity_x) float64 40B 0.0 2.5 5.0 7.5 10.0
Attributes:
my_attribute_name: some meta informationdataset.dims
FrozenMappingWarningOnValuesAccess({'position_x': 5, 'velocity_x': 5})
dataset.variables
Frozen({'position': <xarray.Variable (position_x: 5)> Size: 40B
array([-5. , -2.5,  0. ,  2.5,  5. ])
Attributes:
    unit:       m
    long_name:  Position, 'velocity': <xarray.Variable (velocity_x: 5)> Size: 40B
array([ 0. ,  2.5,  5. ,  7.5, 10. ])
Attributes:
    unit:       m/s
    long_name:  Velocity})
A variable can be “promoted” to (or defined as) a Coordinate for its dimension(s):
values_vel = 1 + values_pos**2
data_vars = dict(
    position=(dimensions_pos, values_pos, attrs_pos),
    # now the velocity array "lies" along the same dimension as the position array
    velocity=(dimensions_pos, values_vel, attrs_vel),
)
dataset = xr.Dataset(
    data_vars=data_vars,
    # NB We could set "position" as a coordinate directly when creating the dataset:
    # coords=dict(position=(dimensions_pos, values_pos, attrs_pos)),
    attrs=dataset_attrs,
)

# Promote the "position" variable to a coordinate:
# In general, most of the functions that modify the structure of the xarray dataset will
# return a new object, hence the assignment
dataset = dataset.set_coords(["position"])
dataset
<xarray.Dataset> Size: 80B
Dimensions:   (position_x: 5)
Coordinates:
    position  (position_x) float64 40B -5.0 -2.5 0.0 2.5 5.0
Dimensions without coordinates: position_x
Data variables:
    velocity  (position_x) float64 40B 26.0 7.25 1.0 7.25 26.0
Attributes:
my_attribute_name: some meta informationdataset.coords["position"]
<xarray.DataArray 'position' (position_x: 5)> Size: 40B
array([-5. , -2.5,  0. ,  2.5,  5. ])
Coordinates:
    position  (position_x) float64 40B -5.0 -2.5 0.0 2.5 5.0
Dimensions without coordinates: position_x
Attributes:
    unit:       m
long_name: PositionNote that the xarray coordinates are available as variables as well:
dataset.variables["position"]
<xarray.Variable (position_x: 5)> Size: 40B
array([-5. , -2.5,  0. ,  2.5,  5. ])
Attributes:
    unit:       m
long_name: PositionWhich, on its own, might not be very useful yet, however, xarray coordinates can be set
to index other variables (to_gridded_dataset()
does this for the Quantify dataset), as shown below (note the bold font in the output!):
dataset = dataset.set_index({"position_x": "position"})
dataset.position_x.attrs["unit"] = "m"
dataset.position_x.attrs["long_name"] = "Position x"
dataset
<xarray.Dataset> Size: 80B
Dimensions:     (position_x: 5)
Coordinates:
  * position_x  (position_x) float64 40B -5.0 -2.5 0.0 2.5 5.0
Data variables:
    velocity    (position_x) float64 40B 26.0 7.25 1.0 7.25 26.0
Attributes:
my_attribute_name: some meta informationAt this point the reader might get very confused. In an attempt to clarify, we now have
a dimension, a coordinate and a variable with the same name "position_x".
(
    "position_x" in dataset.dims,
    "position_x" in dataset.coords,
    "position_x" in dataset.variables,
)
(True, True, True)
dataset.dims["position_x"]
/tmp/ipykernel_421/457231006.py:1: FutureWarning: The return type of `Dataset.dims` will be changed to return a set of dimension names in future, in order to be more consistent with `DataArray.dims`. To access a mapping from dimension names to lengths, please use `Dataset.sizes`.
  dataset.dims["position_x"]
5
dataset.coords["position_x"]
<xarray.DataArray 'position_x' (position_x: 5)> Size: 40B
array([-5. , -2.5,  0. ,  2.5,  5. ])
Coordinates:
  * position_x  (position_x) float64 40B -5.0 -2.5 0.0 2.5 5.0
Attributes:
    unit:       m
long_name: Position xdataset.variables["position_x"]
<xarray.IndexVariable 'position_x' (position_x: 5)> Size: 40B
array([-5. , -2.5,  0. ,  2.5,  5. ])
Attributes:
    unit:       m
long_name: Position xHere the intention is to make the reader aware of this peculiar behavior. Please consult the xarray documentation for more details.
An example of how this can be useful is to retrieve data from an xarray variable using one of its coordinates to select the desired entries:
dataset.velocity
<xarray.DataArray 'velocity' (position_x: 5)> Size: 40B
array([26.  ,  7.25,  1.  ,  7.25, 26.  ])
Coordinates:
  * position_x  (position_x) float64 40B -5.0 -2.5 0.0 2.5 5.0
Attributes:
    unit:       m/s
long_name: Velocityretrieved_value = dataset.velocity.sel(position_x=2.5)
retrieved_value
<xarray.DataArray 'velocity' ()> Size: 8B
array(7.25)
Coordinates:
    position_x  float64 8B 2.5
Attributes:
    unit:       m/s
long_name: VelocityNote that without this feature we would have to keep track of numpy integer indexes to retrieve the desired data:
dataset.velocity.values[3], retrieved_value.values == dataset.velocity.values[3]
(np.float64(7.25), np.True_)
One of the great features of xarray is automatic plotting (explore the xarray documentation for more advanced capabilities!):
_ = dataset.velocity.plot(marker="o")
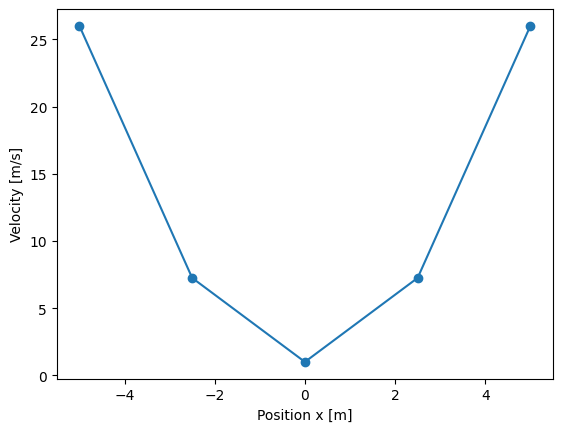
Note the automatic labels and unit.