Tutorial 5. Plot monitor
In this tutorial we dive into the capabilities of the plot monitor. We will create a fictional device and showcase how the plot monitor can be used. Enjoy!
import numpy as np
from IPython.core.interactiveshell import InteractiveShell
from qcodes import Instrument, ManualParameter

from quantify_core.data.handling import get_tuids_containing, set_datadir
from quantify_core.measurement import MeasurementControl
from quantify_core.utilities.examples_support import default_datadir
from quantify_core.visualization.pyqt_plotmon import PlotMonitor_pyqt

rng = np.random.default_rng(seed=555555)  # random number generator

# Display any variable or statement on its own line
InteractiveShell.ast_node_interactivity = "all"
Before instantiating any instruments or starting a measurement we change the
directory in which the experiments are saved using the
set_datadir()
[get_datadir()] functions.
Tip: What data directory should I use?
We highly recommended to settle for a single common data directory for all
notebooks/experiments within your measurement setup/PC (e.g. ~/quantify-data
(unix) or D:\\quantify-data (Windows).
The utilities to find/search/extract data only work if all the experiment containers
are located within the same directory.
set_datadir(default_datadir())
Data will be saved in:
/home/slavoutich/quantify-data
QCoDeS drivers for our instruments
class Device(Instrument):
    """A dummy instrument."""

    def __init__(self, name: str):
        super().__init__(name=name)

        self.add_parameter(name="amp_0", unit="A", parameter_class=ManualParameter)
        self.add_parameter(name="amp_1", unit="A", parameter_class=ManualParameter)
        self.add_parameter(name="offset", unit="A", parameter_class=ManualParameter)

        self.add_parameter(
            name="adc", label="ADC input", unit="V", get_cmd=self._get_dac_value
        )

    def _get_dac_value(self):
        s1 = np.exp(-3 * self.amp_0()) * np.sin(self.amp_0() * 2 * np.pi * 3)
        s2 = np.cos(self.amp_1() * 2 * np.pi * 2)
        return s1 + s2 + rng.uniform(0, 0.2) + self.offset()
Instantiate the instruments
meas_ctrl = MeasurementControl("meas_ctrl")
plotmon = PlotMonitor_pyqt("Plot Monitor")
meas_ctrl.instr_plotmon(plotmon.name)
device = Device("Device")
Overview
There are 3 parameters in the PlotMonitor_pyqt that control the datasets being displayed.
Two main parameters determine the datasets being displayed: tuids and tuids_extra.
plotmon.tuids()
plotmon.tuids_extra()
[]
[]
The interface is the same for both. The parameters accept a list of tuids or an empty list to reset.
# Example of loading datasets onto the plot
# plotmon.tuids(["20201124-184709-137-8a5112", "20201124-184716-237-918bee"])
# plotmon.tuids_extra(["20201124-184722-988-0463d4", "20201124-184729-618-85970f"])
The difference is that the MeasurementControl uses tuids and overrides them when running measurements.
Note
All the datasets must have matching data variables (settables and gettables).
The third relevant parameter is the tuids_max_num. It accepts an integer which determines the maximum number of dataset that will be stored in tuids when the MeasurementControl is running.
plotmon.tuids_max_num()
3
Note
This parameter has no effect when setting the tuids manually.
Usage examples
# set initial values to emulate the instrument state
device.amp_0(0.0)
device.amp_1(0.0)
device.offset(0.0)
n_pnts = 50
meas_ctrl.settables(device.amp_0)
meas_ctrl.setpoints(np.linspace(0, 1, n_pnts))
meas_ctrl.gettables(device.adc)
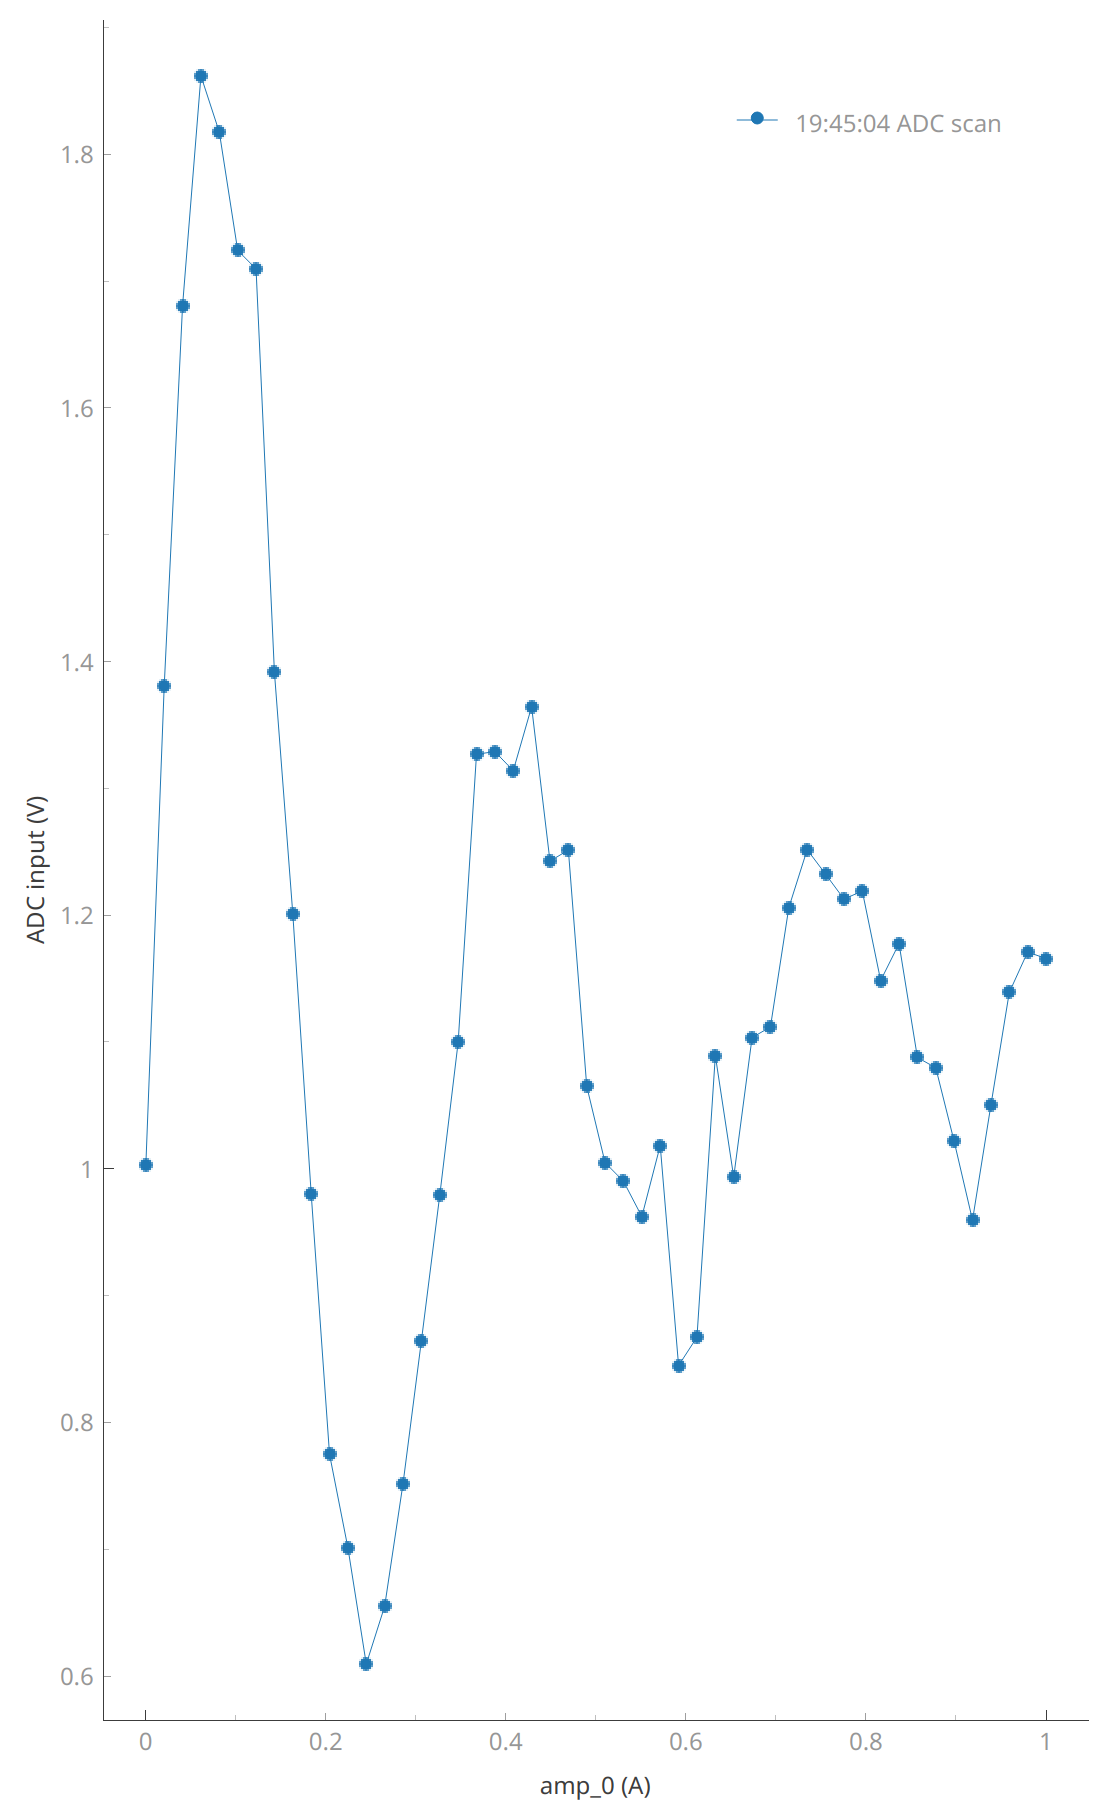
dset = meas_ctrl.run("ADC scan")
plotmon.main_QtPlot
Starting iterative measurement...

  2% completed | elapsed time:      0s | time left:      5s
  2% completed | elapsed time:      0s | time left:      5s
100% completed | elapsed time:      0s | time left:      0s

100% completed | elapsed time:      0s | time left:      0s
n_pnts = 20
meas_ctrl.settables(device.amp_0)
meas_ctrl.setpoints(np.linspace(0, 1, n_pnts))
meas_ctrl.gettables(device.adc)
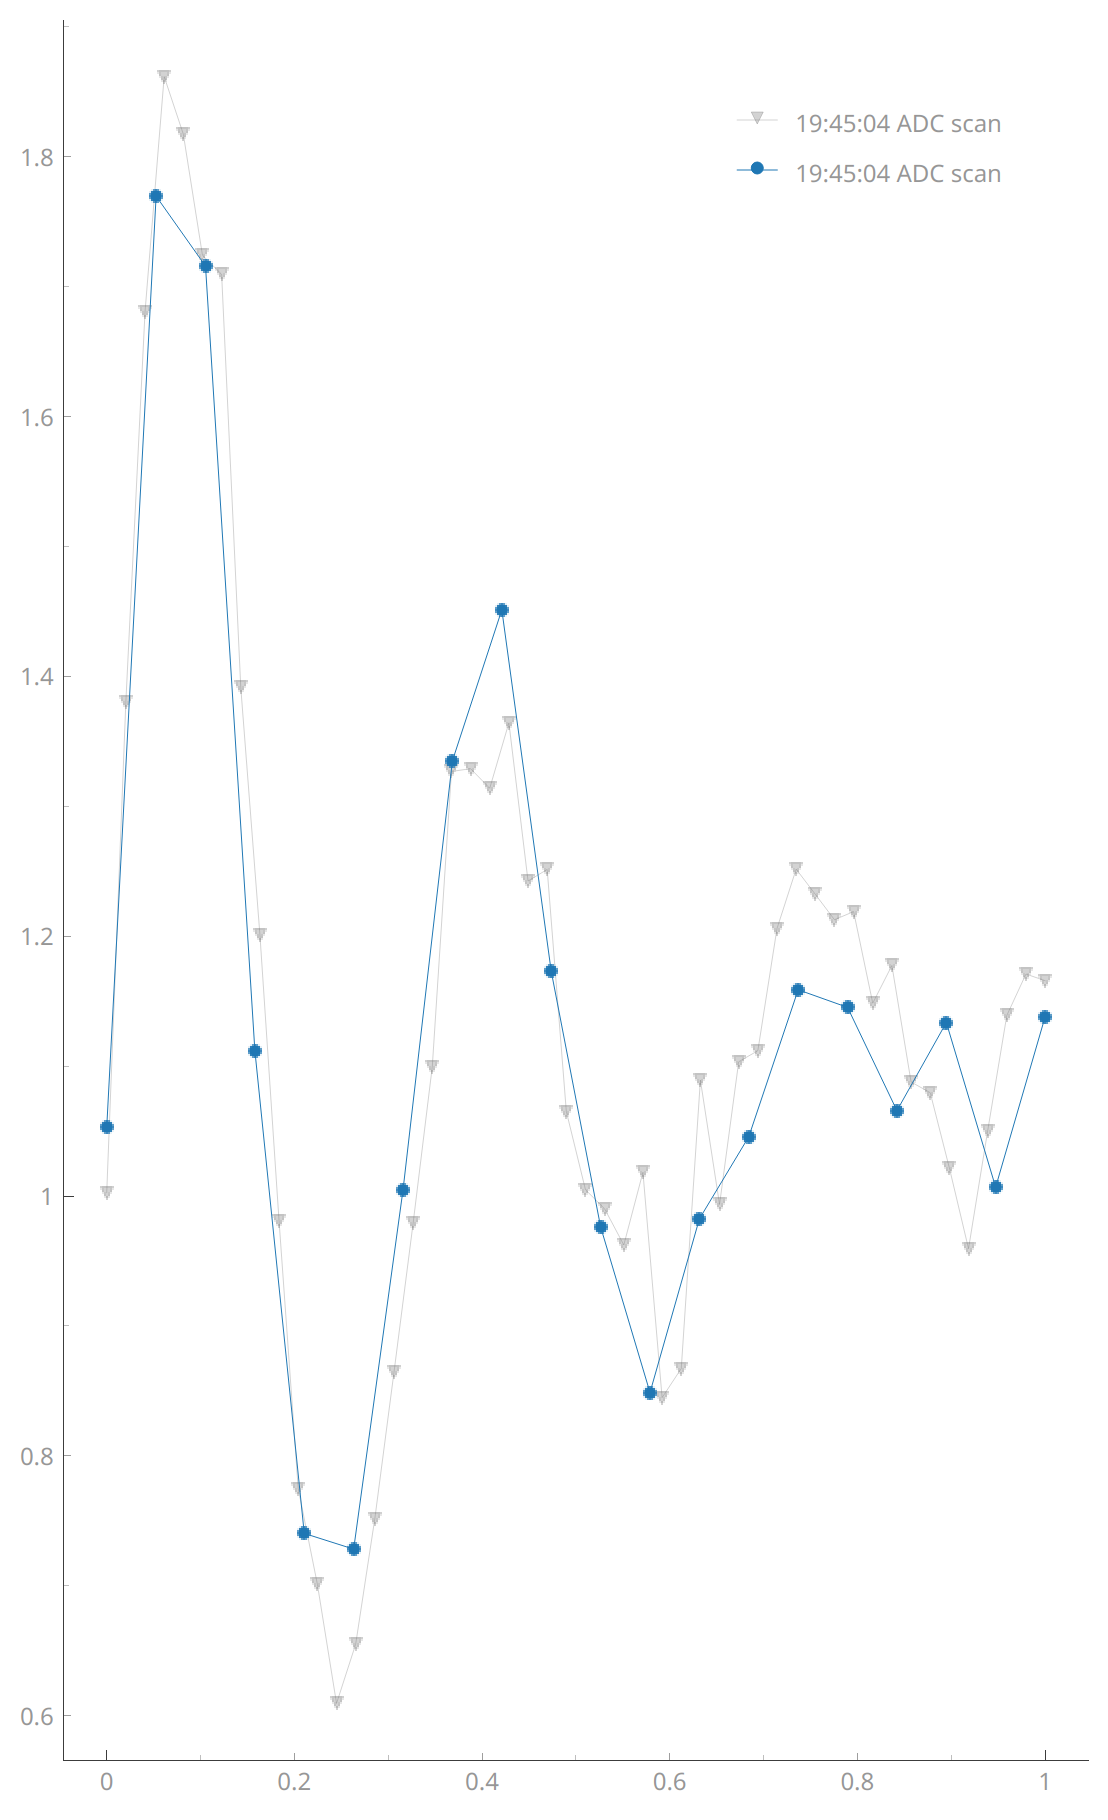
dset = meas_ctrl.run("ADC scan")
plotmon.main_QtPlot
Starting iterative measurement...

100% completed | elapsed time:      0s | time left:      0s

100% completed | elapsed time:      0s | time left:      0s
n_pnts = 30

meas_ctrl.settables(device.amp_0)
meas_ctrl.setpoints(np.linspace(0, 1, n_pnts))
meas_ctrl.gettables(device.adc)
dset = meas_ctrl.run("ADC scan")

plotmon.main_QtPlot
Starting iterative measurement...

100% completed | elapsed time:      0s | time left:      0s

100% completed | elapsed time:      0s | time left:      0s
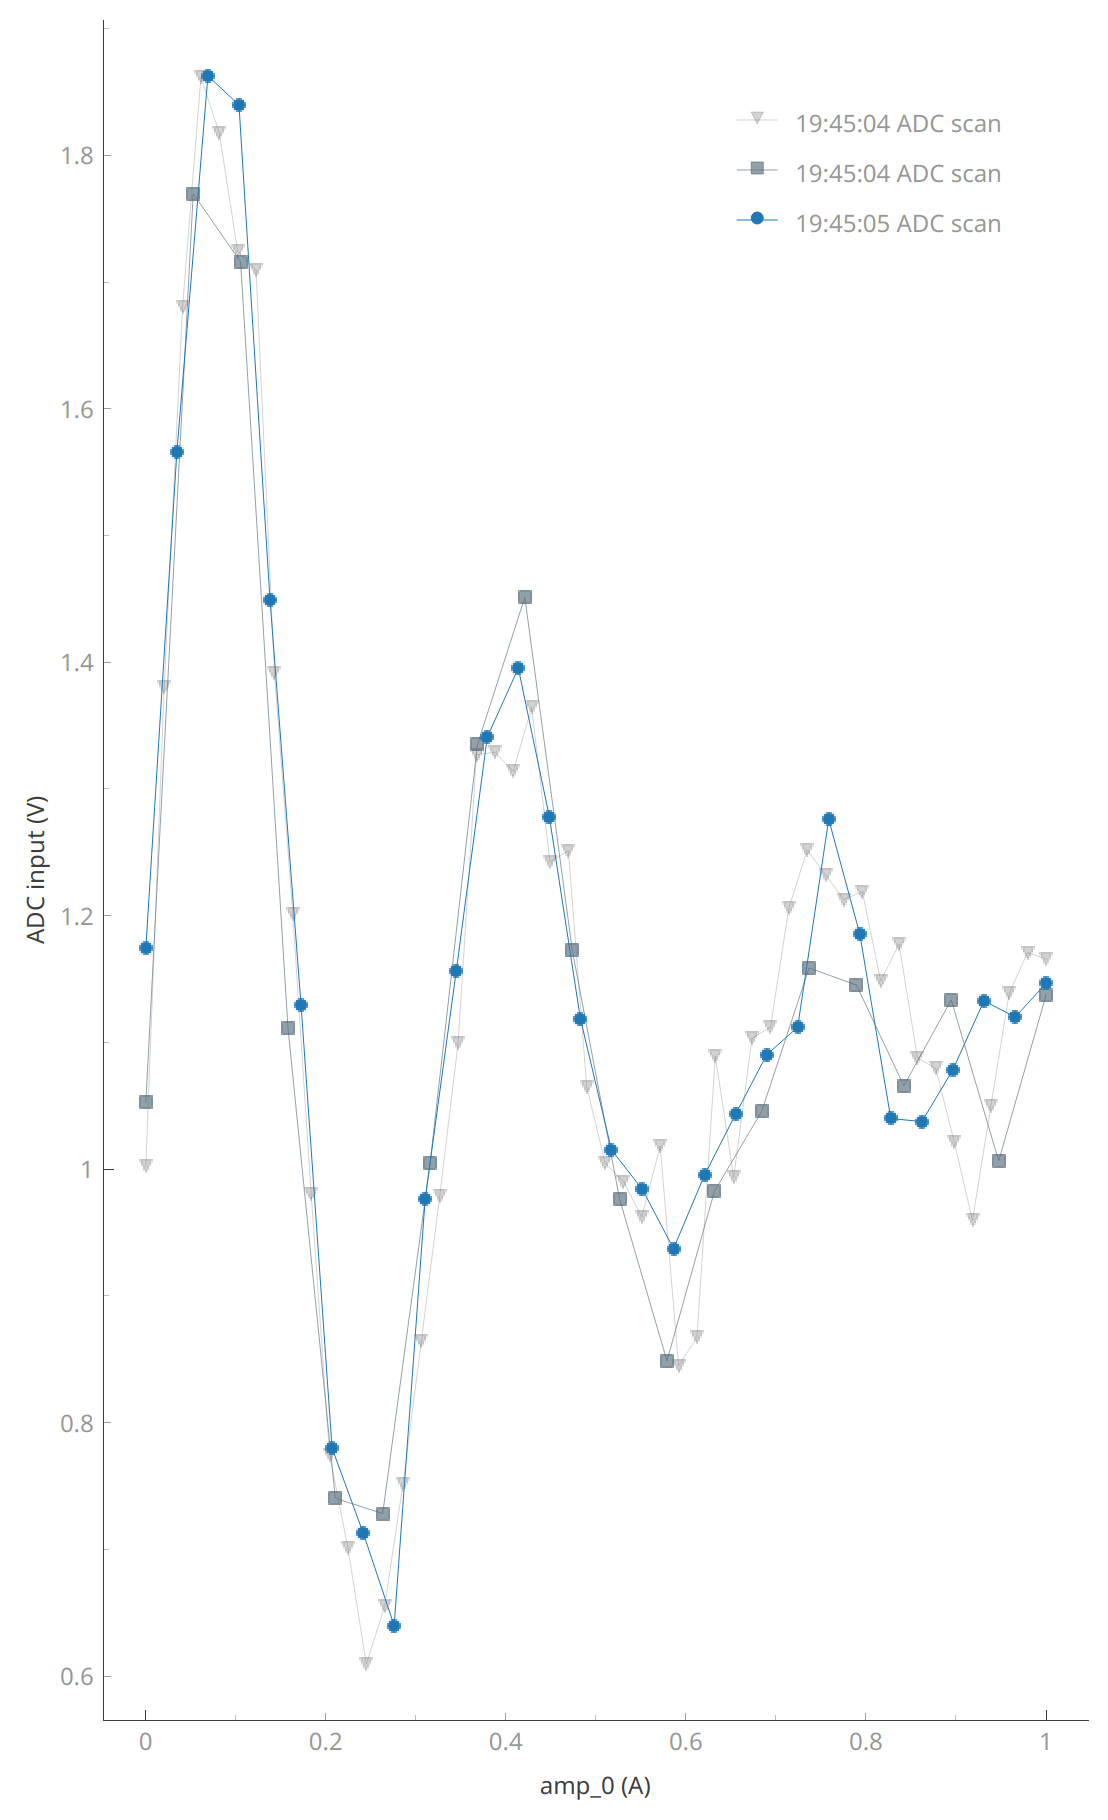
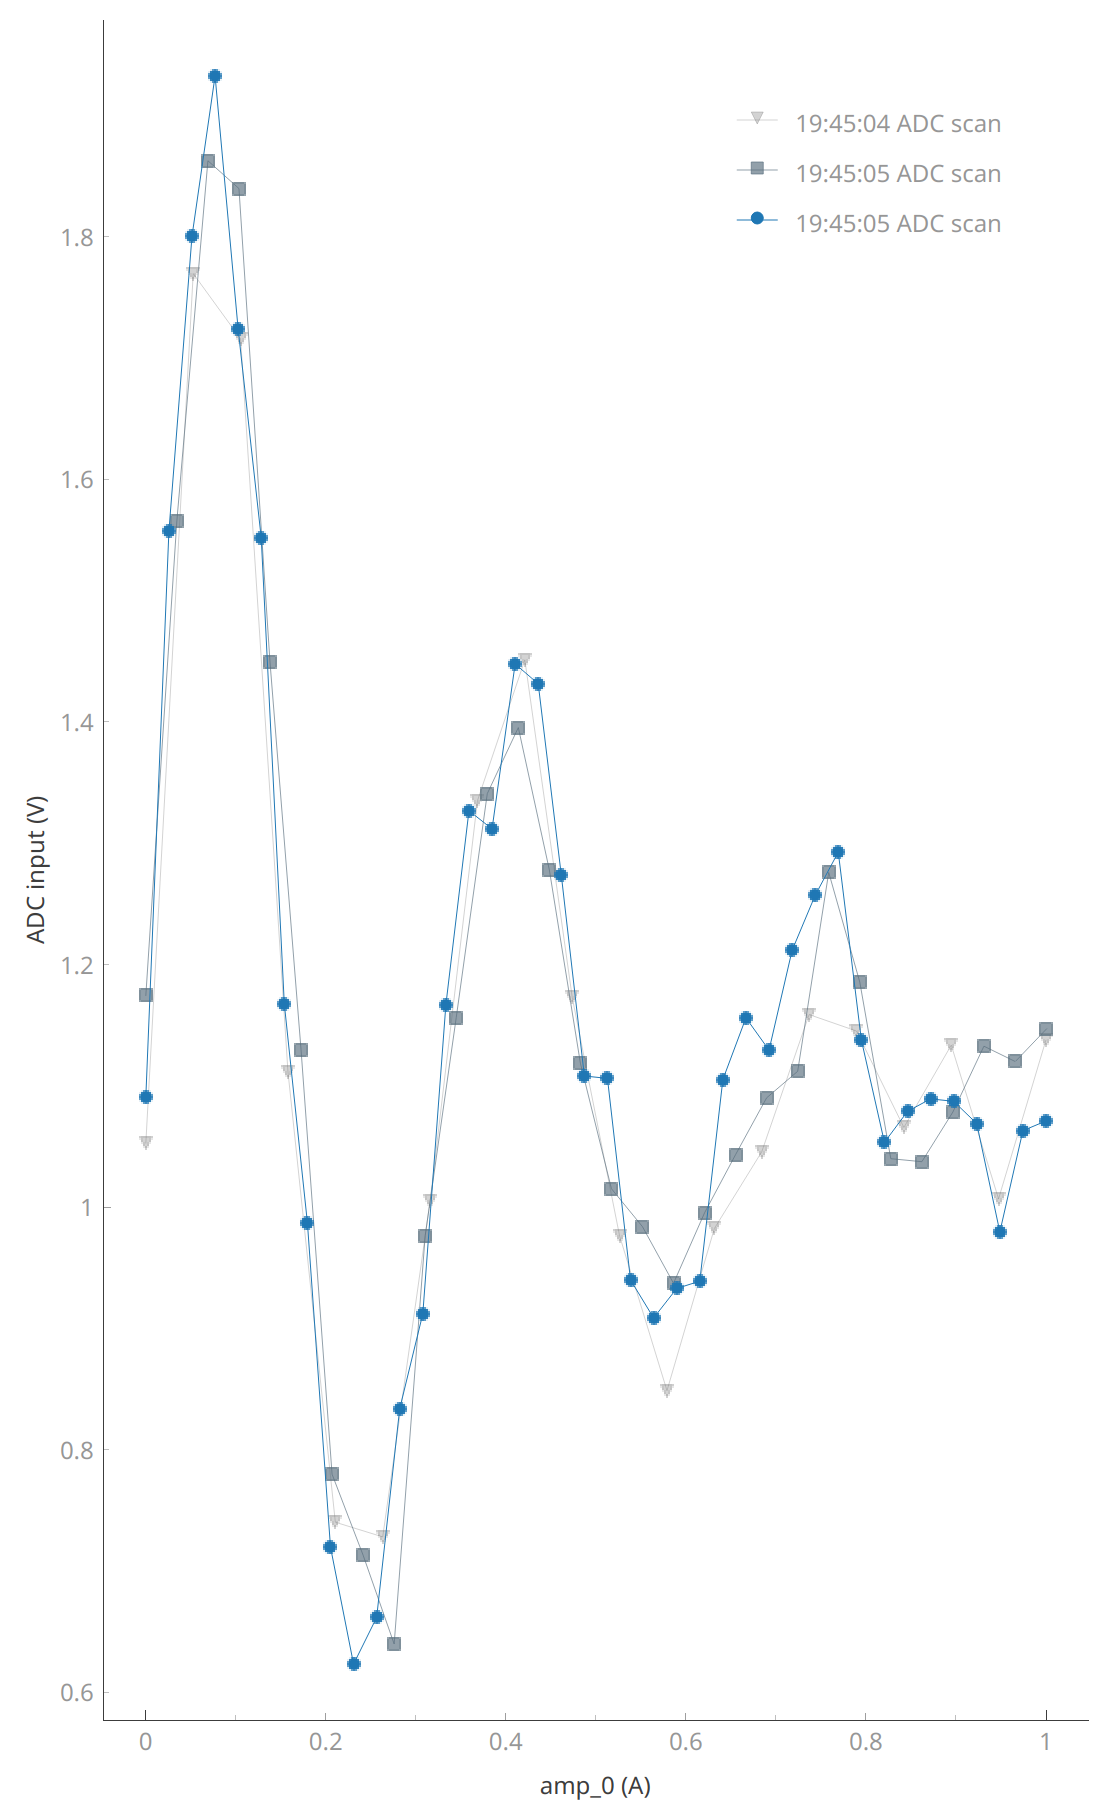
Now the oldest dataset will vanish from the plot:
# Now the oldest dataset will vanish from the plot

n_pnts = 40

meas_ctrl.settables(device.amp_0)
meas_ctrl.setpoints(np.linspace(0, 1, n_pnts))
meas_ctrl.gettables(device.adc)
dset = meas_ctrl.run("ADC scan")

plotmon.main_QtPlot
Starting iterative measurement...

100% completed | elapsed time:      0s | time left:      0s

100% completed | elapsed time:      0s | time left:      0s
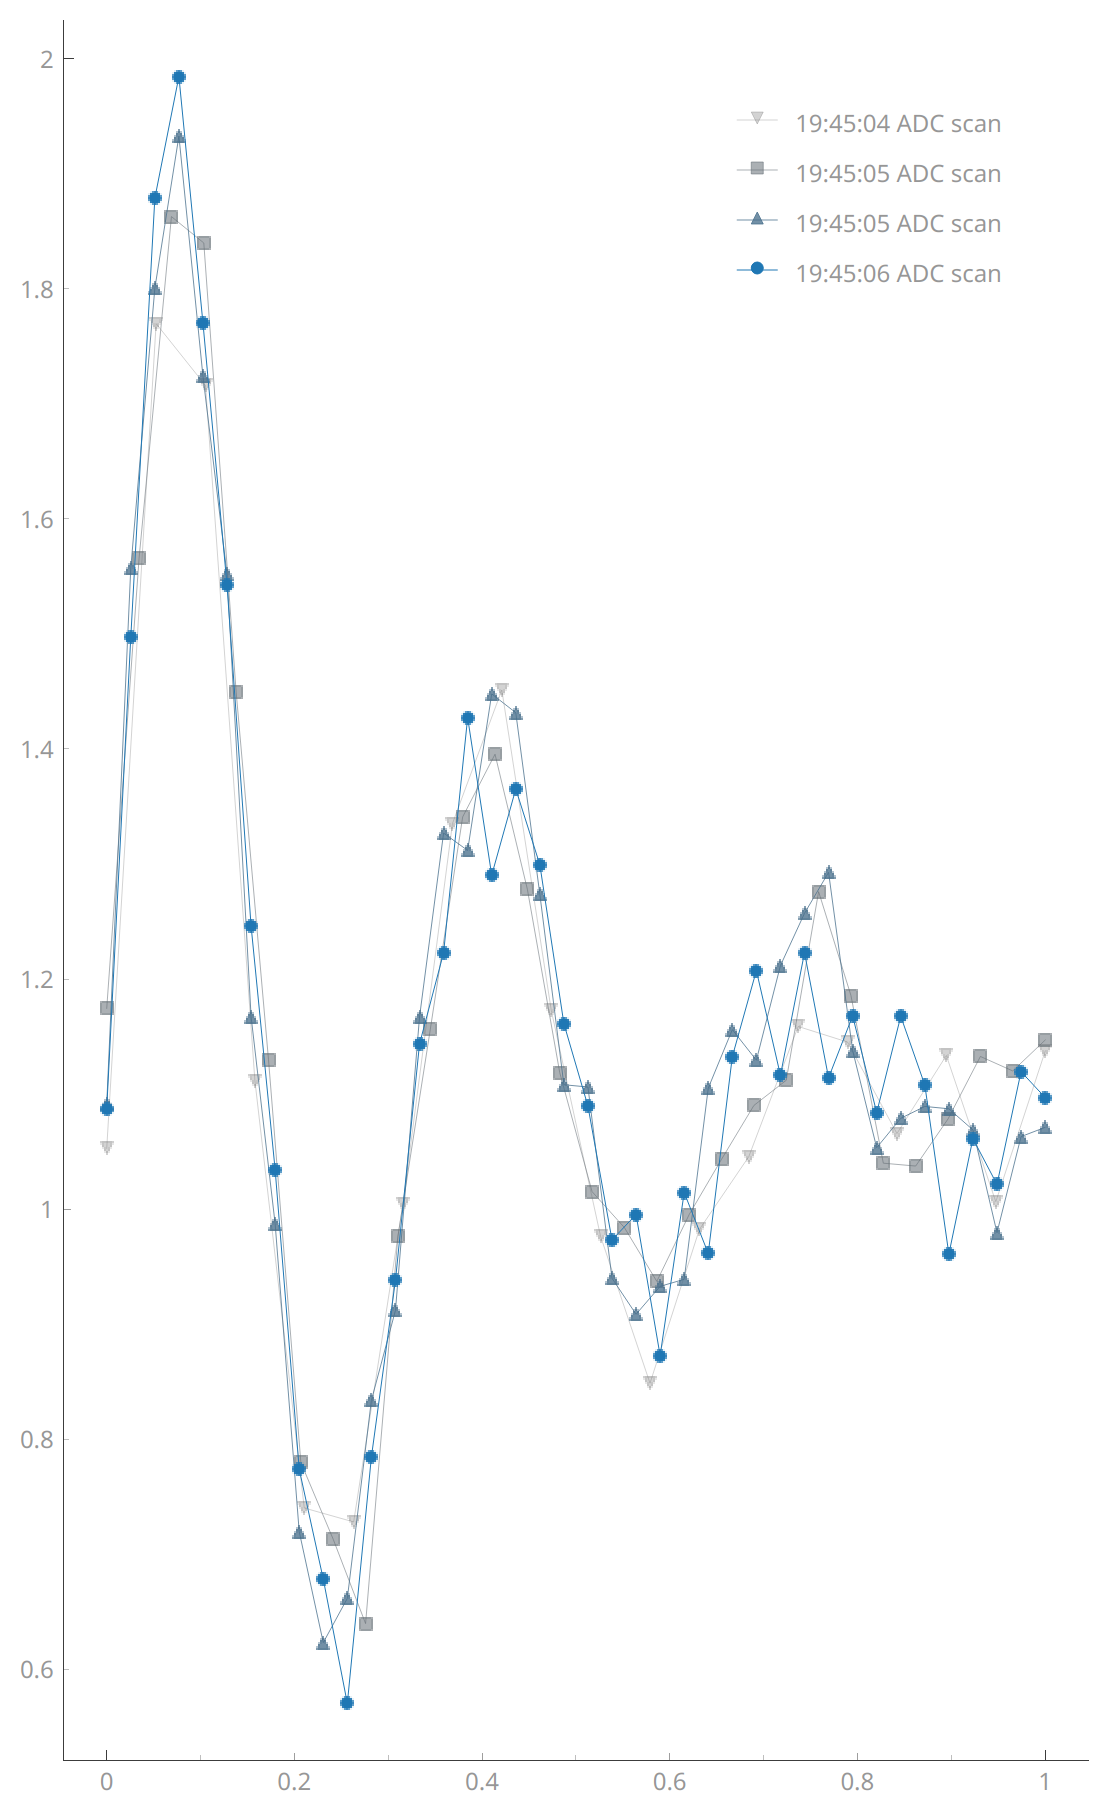
We can accumulate more datasets on the plot if we want to:
# We can accumulate more datasets on the plot if we want to
plotmon.tuids_max_num(4)
n_pnts = 40

meas_ctrl.settables(device.amp_0)
meas_ctrl.setpoints(np.linspace(0, 1, n_pnts))
meas_ctrl.gettables(device.adc)
dset = meas_ctrl.run("ADC scan")

plotmon.main_QtPlot
Starting iterative measurement...

  2% completed | elapsed time:      0s | time left:      4s
  2% completed | elapsed time:      0s | time left:      4s
100% completed | elapsed time:      0s | time left:      0s

100% completed | elapsed time:      0s | time left:      0s
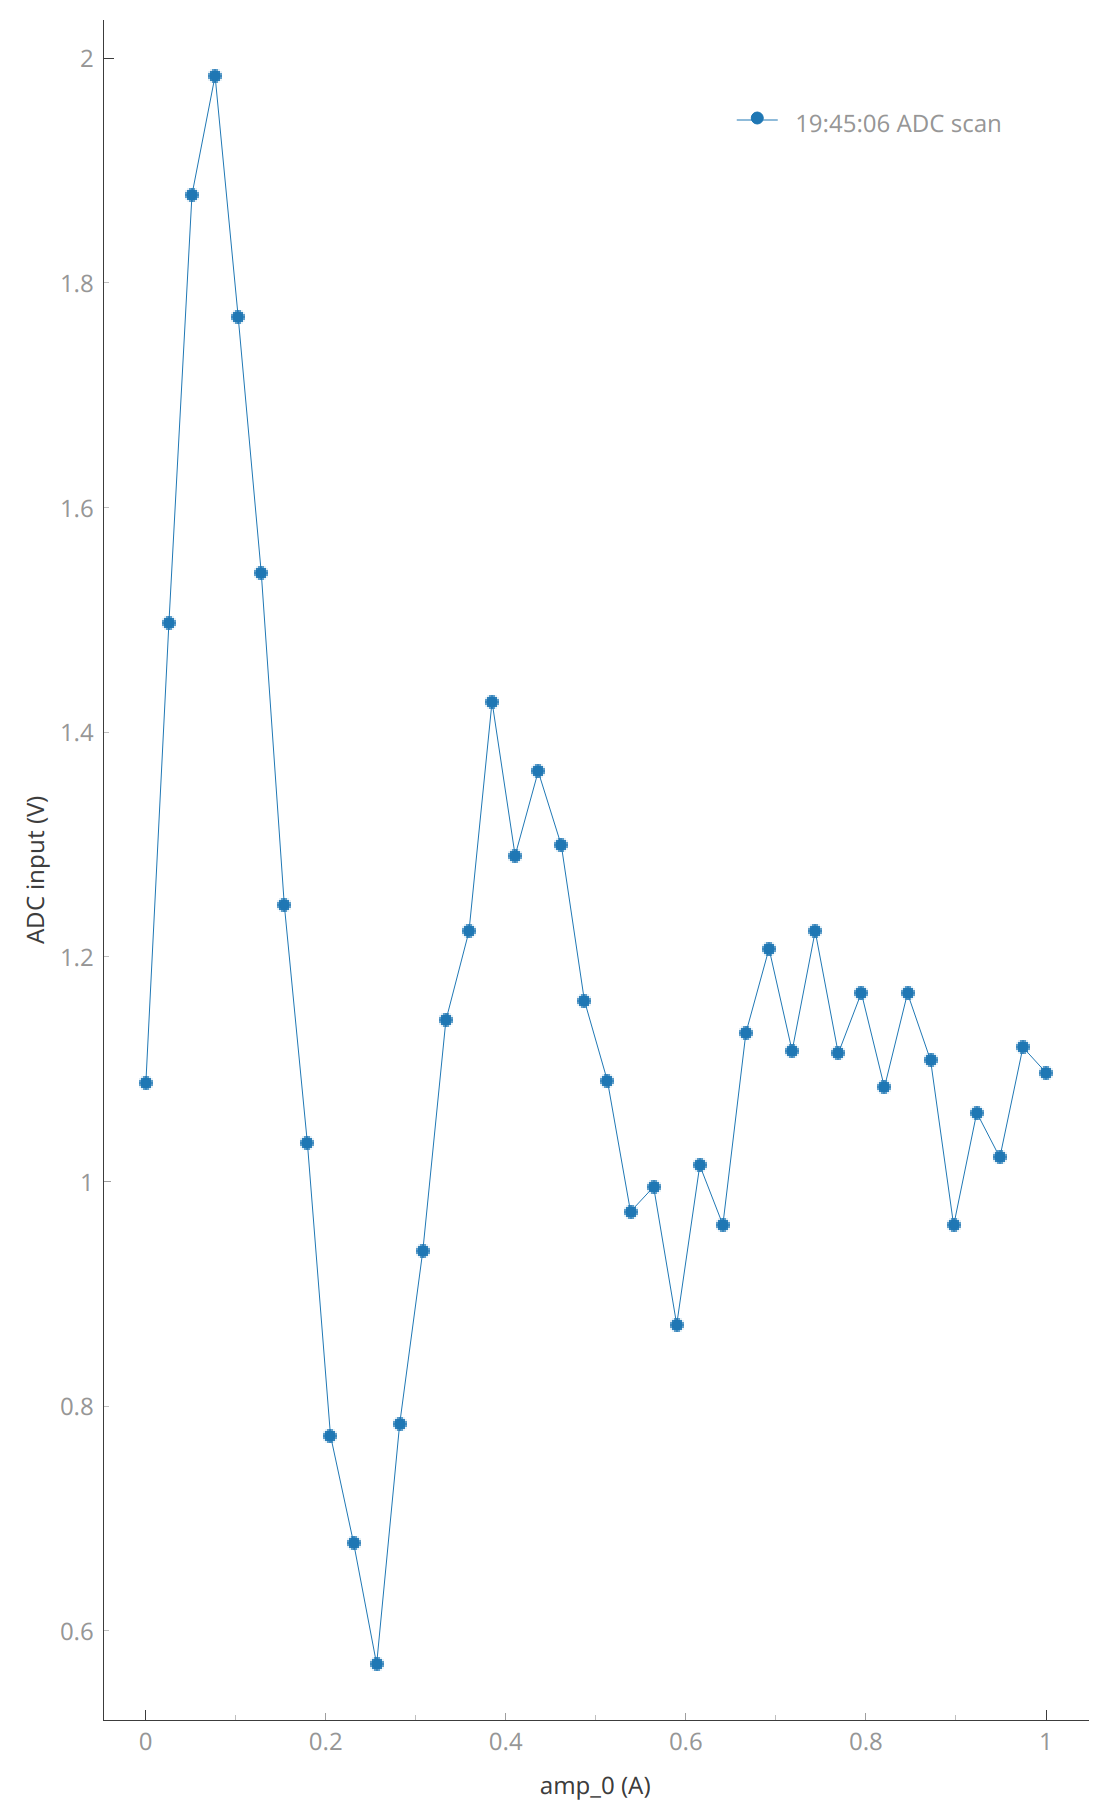
Or we can disable the accumulation and plot a single dataset:
# Or we can disable the accumulation and plot a single dataset
plotmon.tuids_max_num(1)

plotmon.main_QtPlot
This can also be reset:
# This can also be reset with
plotmon.tuids([])

plotmon.main_QtPlot  # The plotting window will vanish, it is supposed to

For now, we will allow two datasets on the plot monitor.
# For now we will allow two datasets on the plot monitor
plotmon.tuids_max_num(2)
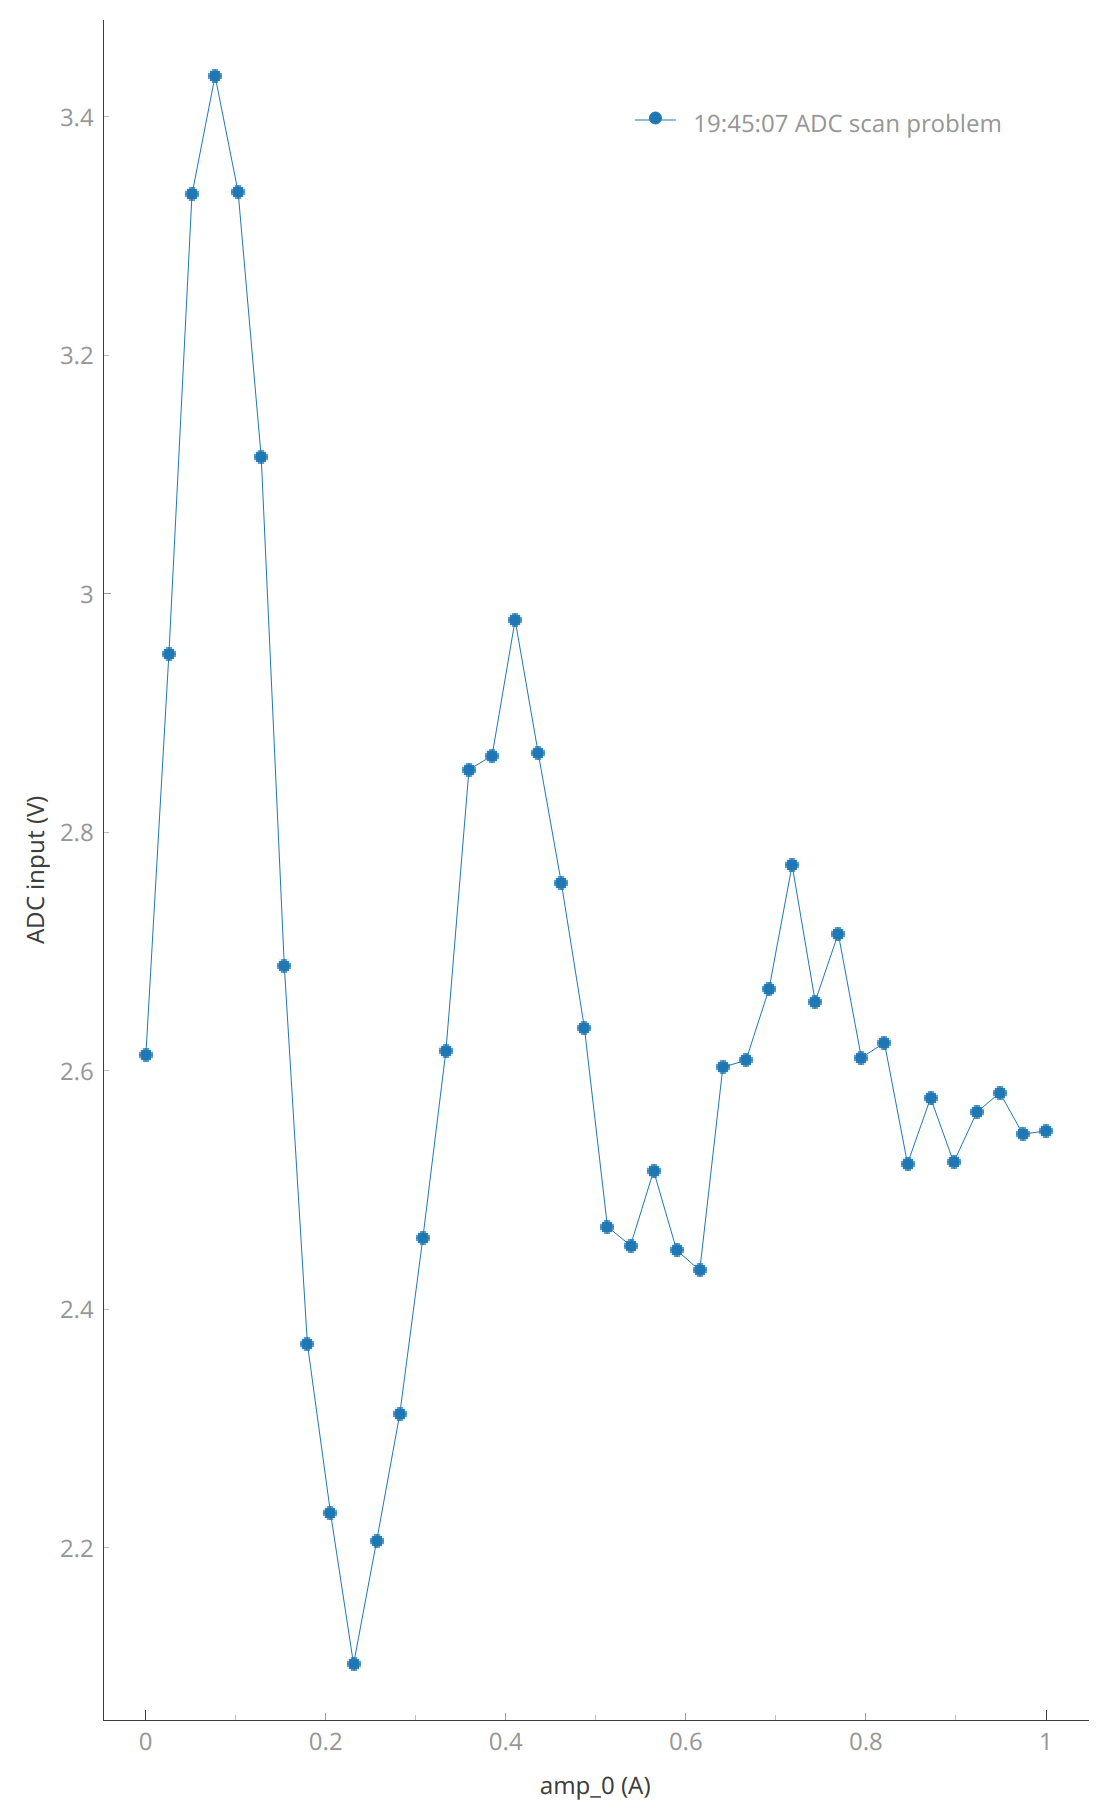
Now let’s imagine that something strange is happening with our setup…
# Now let's imagine that something strange is happening with our setup
device.offset(1.5)

n_pnts = 40
meas_ctrl.settables(device.amp_0)
meas_ctrl.setpoints(np.linspace(0, 1, n_pnts))
meas_ctrl.gettables(device.adc)
dset = meas_ctrl.run("ADC scan problem")

plotmon.main_QtPlot
Starting iterative measurement...

  2% completed | elapsed time:      0s | time left:      4s
  2% completed | elapsed time:      0s | time left:      4s
100% completed | elapsed time:      0s | time left:      0s

100% completed | elapsed time:      0s | time left:      0s
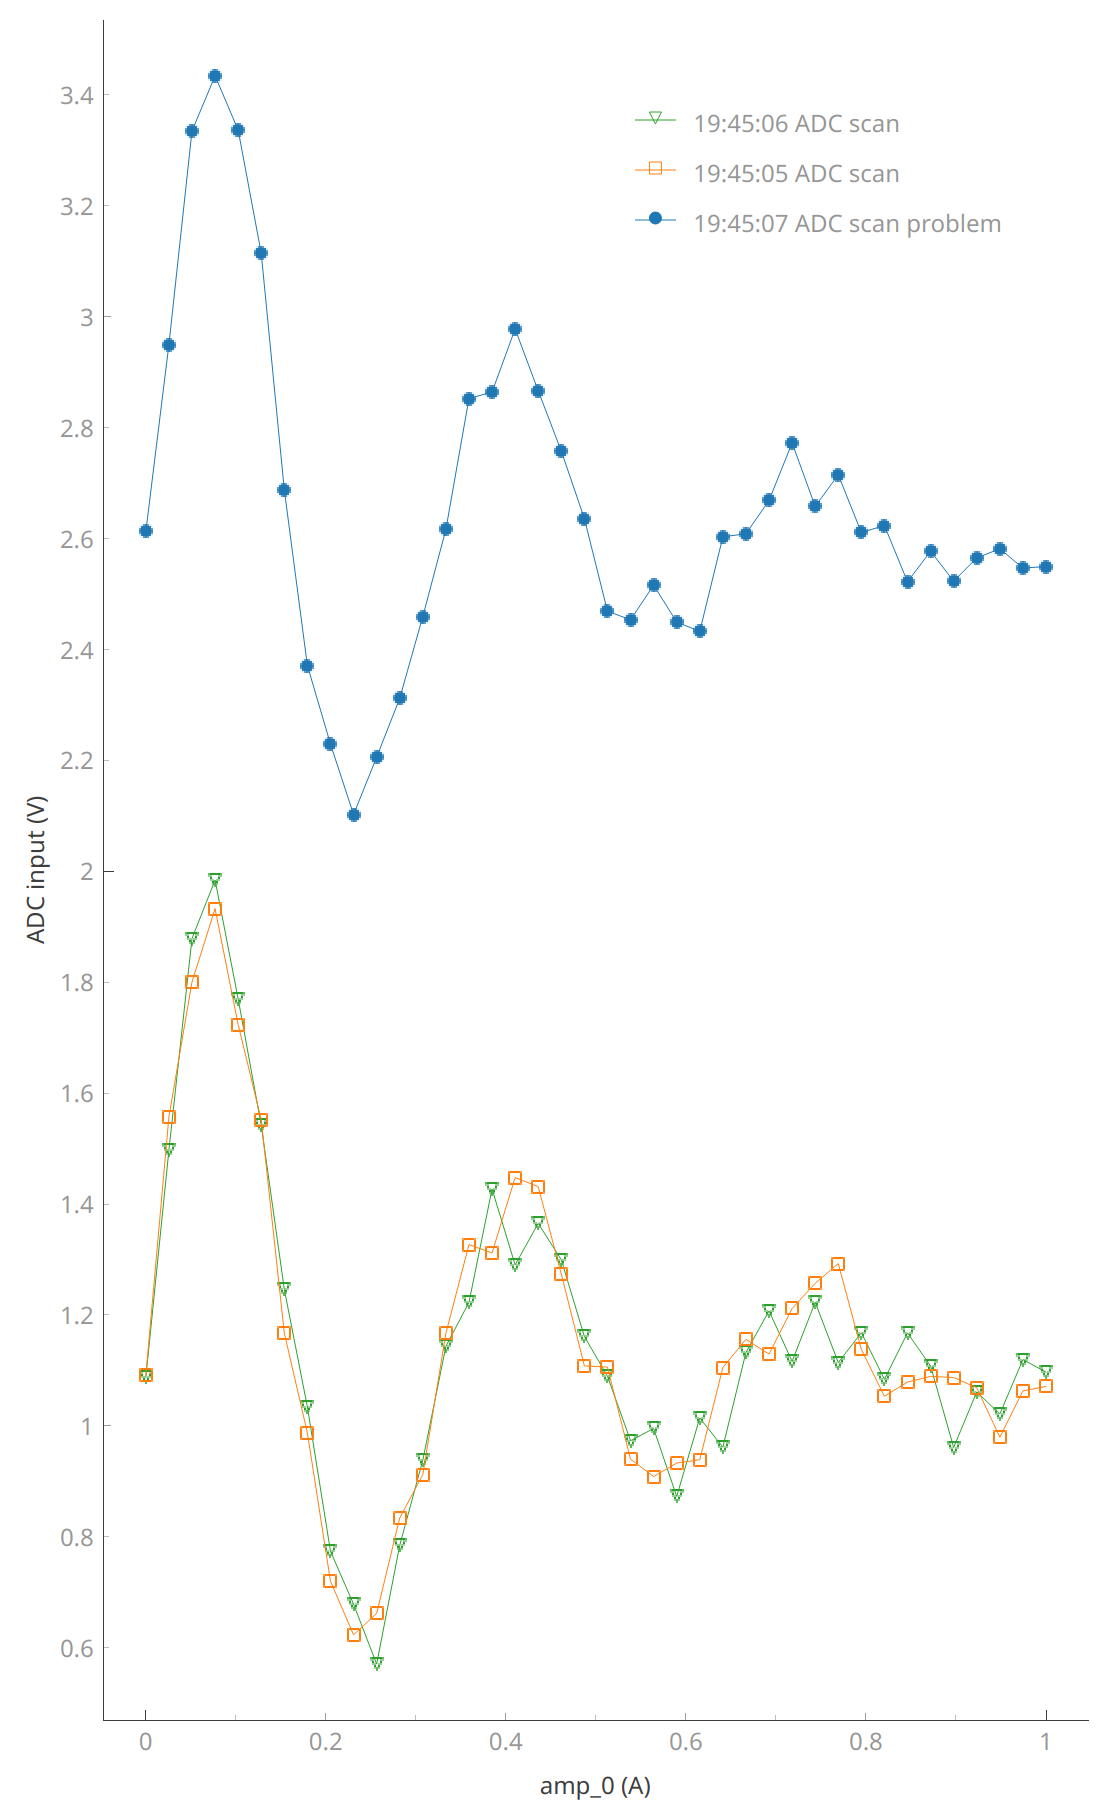
We would like to compare if the current behavior matches for example what we got a few minutes ago:
# We would like to compare if the current behavior matches for example
# what we got a few minutes ago

reference_tuids = sorted(get_tuids_containing("ADC"))[-3:-1]

plotmon.tuids_extra(reference_tuids)
plotmon.main_QtPlot
OK… that cable was not connected in the right place…
device.offset(0.0)  # OK... that cable was not connected in the right place...

# Now let's run again our experiments while we compare it to the previous one in realtime

n_pnts = 30
meas_ctrl.settables(device.amp_0)
meas_ctrl.setpoints(np.linspace(0, 1, n_pnts))
meas_ctrl.gettables(device.adc)
dset = meas_ctrl.run("ADC scan")

n_pnts = 40
meas_ctrl.settables(device.amp_0)
meas_ctrl.setpoints(np.linspace(0, 1, n_pnts))
meas_ctrl.gettables(device.adc)
dset = meas_ctrl.run("ADC scan")

print("Yey! We have recovered our setup!")
plotmon.main_QtPlot
Starting iterative measurement...

  3% completed | elapsed time:      0s | time left:      2s
  3% completed | elapsed time:      0s | time left:      2s
100% completed | elapsed time:      0s | time left:      0s

100% completed | elapsed time:      0s | time left:      0s
Starting iterative measurement...

100% completed | elapsed time:      0s | time left:      0s

100% completed | elapsed time:      0s | time left:      0s  Yey! We have recovered our setup!
We do not need the reference datasets anymore
# We do not need the reference datasets anymore
plotmon.tuids_extra([])
plotmon.main_QtPlot
# Note: both plotmon.tuids_extra and plotmon.tuids can be used
# but keep in mind that meas_ctrl also uses the plotmon.tuids

tuids = get_tuids_containing("problem")[0:1]
tuids
plotmon.tuids(tuids)

n_pnts = 40
meas_ctrl.settables(device.amp_0)
meas_ctrl.setpoints(np.linspace(0, 1, n_pnts))
meas_ctrl.gettables(device.adc)
dset = meas_ctrl.run("ADC scan")

plotmon.main_QtPlot
['20230902-163858-865-c0d3a8']
Starting iterative measurement...

  2% completed | elapsed time:      0s | time left:      8s
  2% completed | elapsed time:      0s | time left:      8s
100% completed | elapsed time:      0s | time left:      0s

100% completed | elapsed time:      0s | time left:      0s
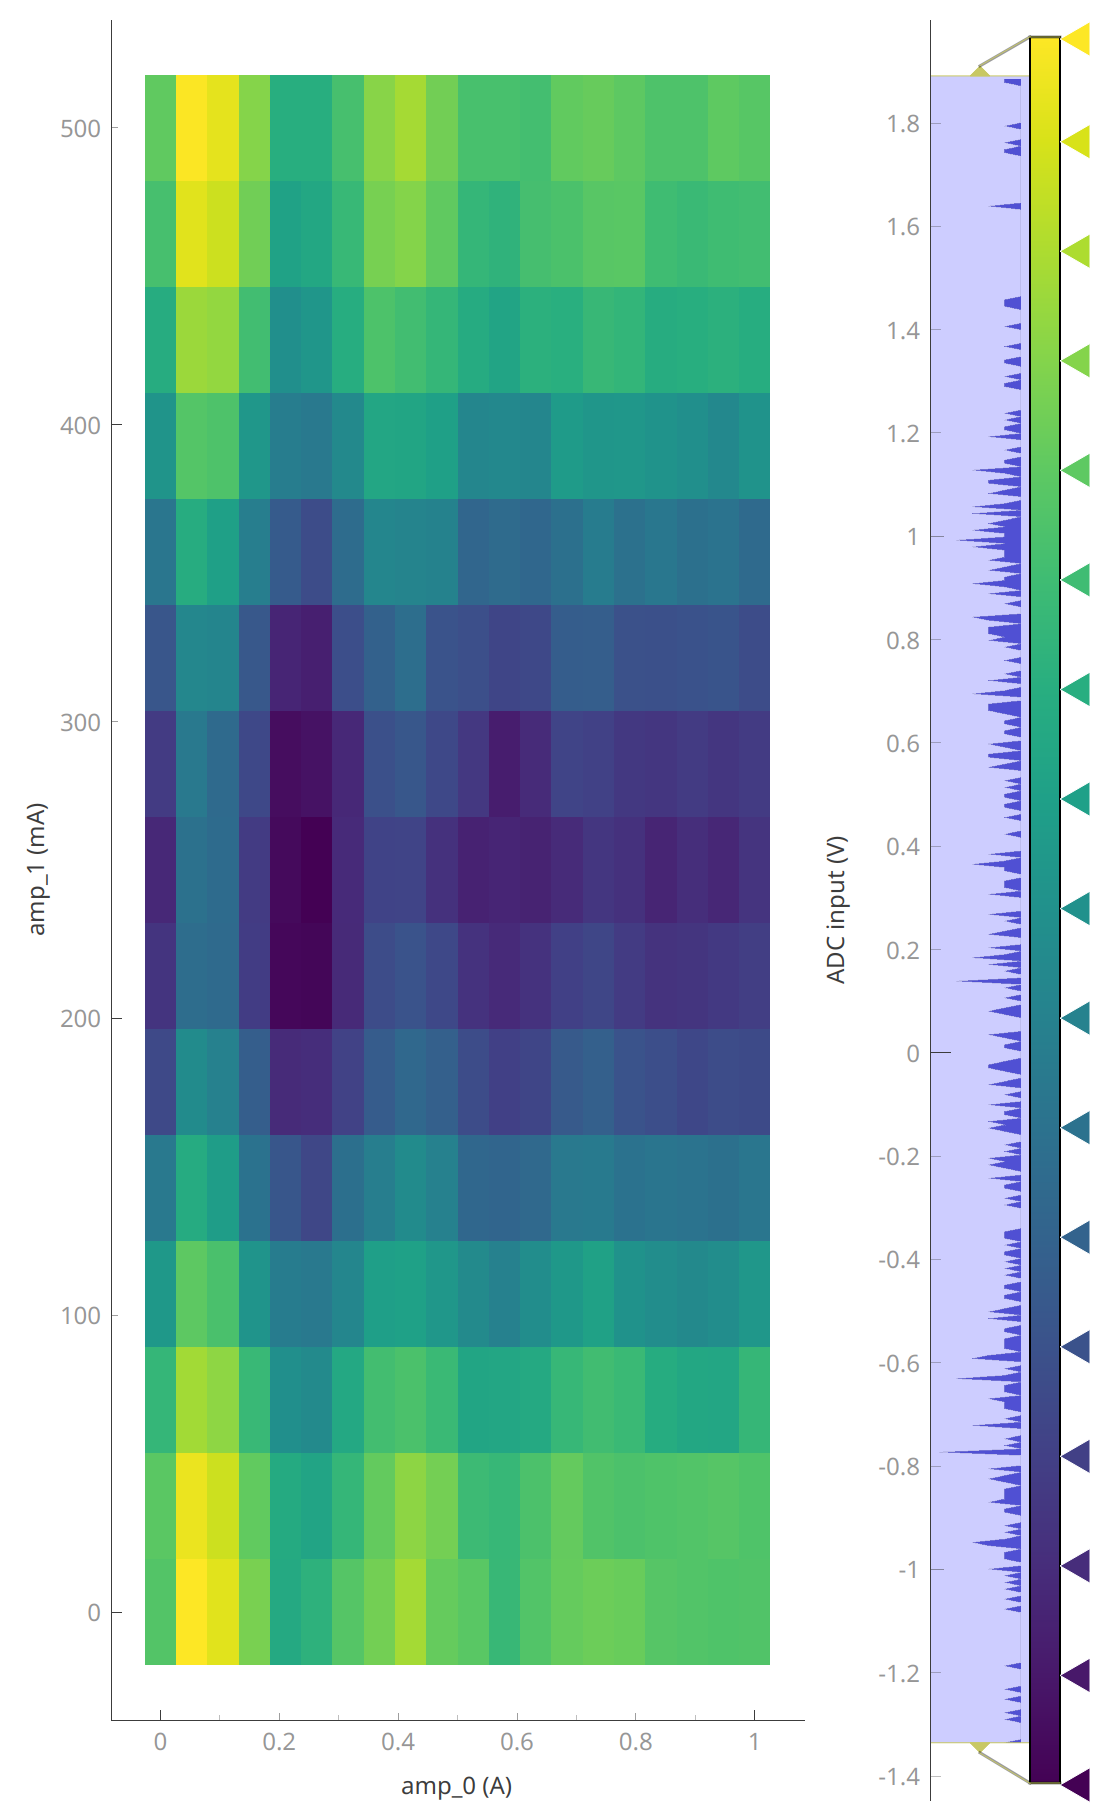
When we have 2D plots only the first dataset from plotmon.tuids or plotmon.tuids_extra will be plotted in the secondary window, in that order of priority.
# When we have 2D plots only the first dataset from plotmon.tuids or
# plotmon.tuids_extra, in that order of priority, will be plotted in the
# secondary window

meas_ctrl.settables([device.amp_0, device.amp_1])
meas_ctrl.setpoints_grid([np.linspace(0, 1, 20), np.linspace(0, 0.5, 15)])
meas_ctrl.gettables(device.adc)
dset = meas_ctrl.run("ADC scan 2D")
reference_tuid_2D = dset.attrs["tuid"]

plotmon.main_QtPlot
plotmon.secondary_QtPlot
Starting iterative measurement...

100% completed | elapsed time:      0s | time left:      0s

100% completed | elapsed time:      0s | time left:      0s
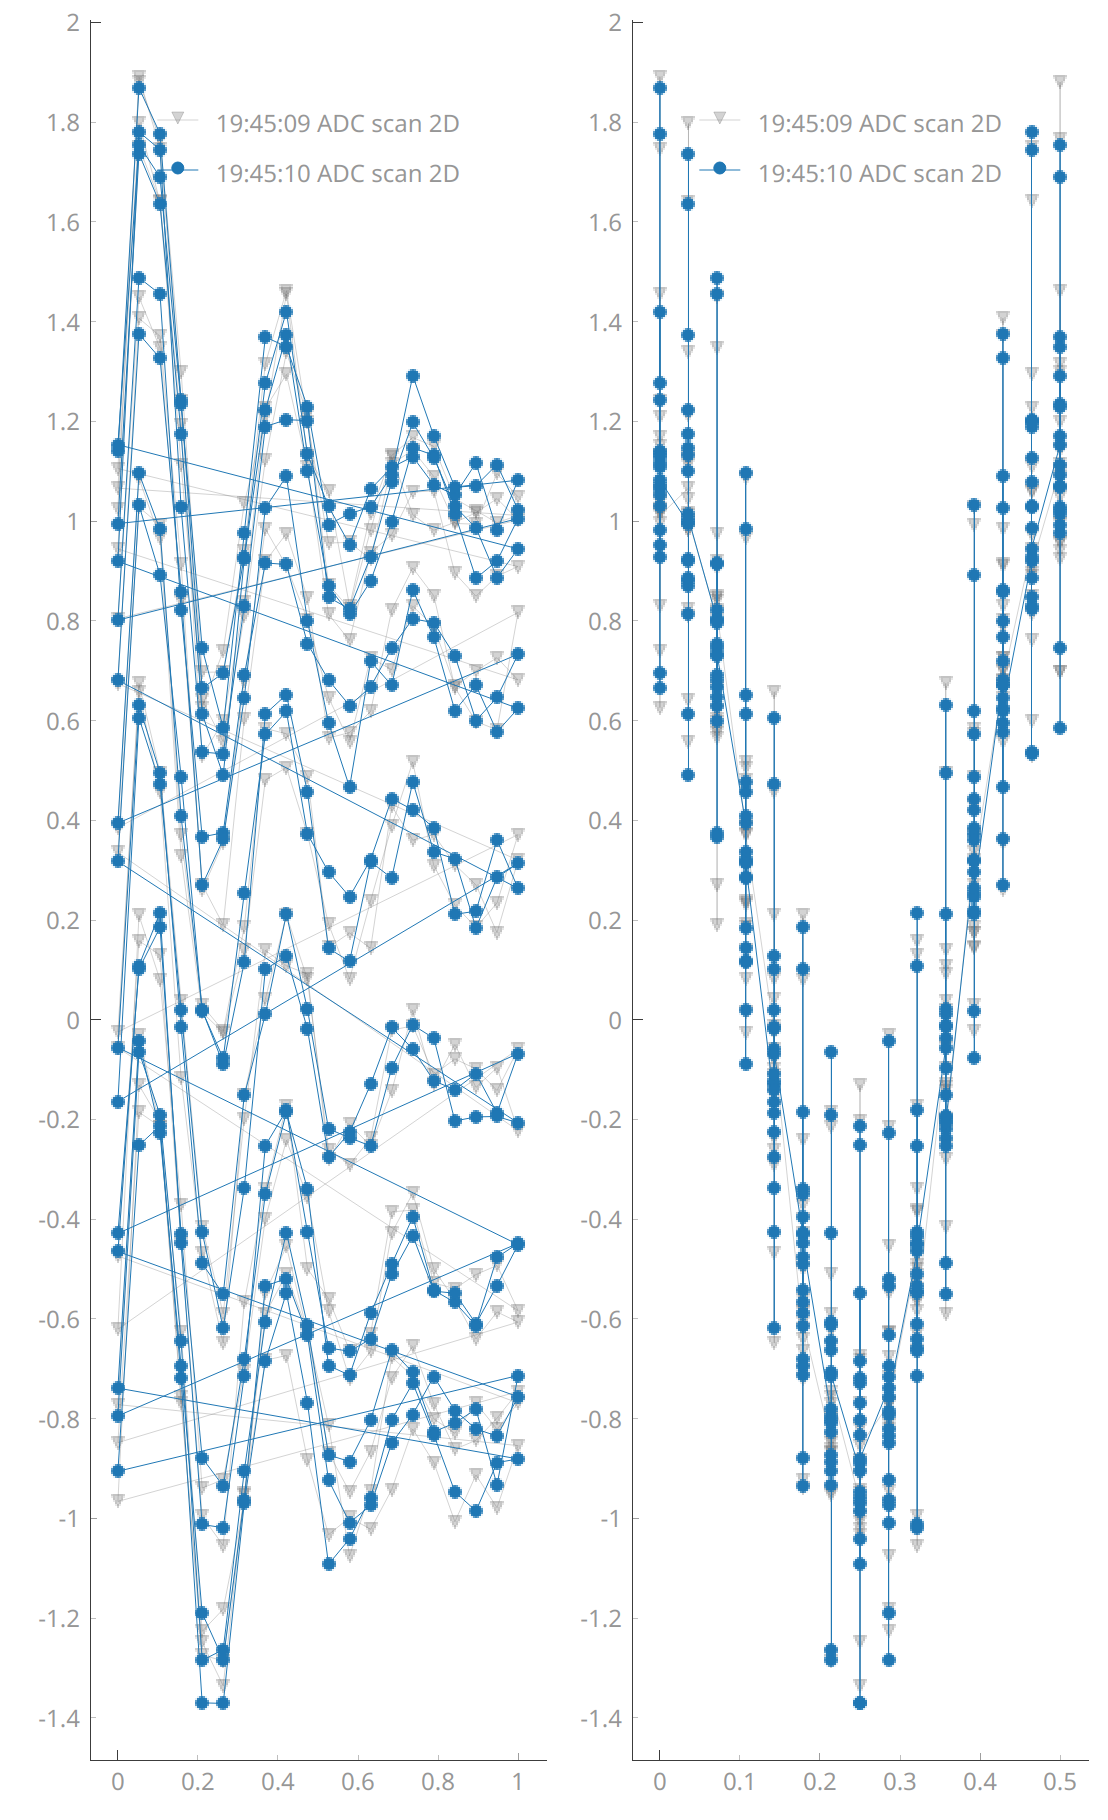
Note
The secondary window displays the last dataset with a 2D structure, and it remains persistent until replaced by a new dataset with a 2D structure.
Mind that the data on the secondary window does not always display data corresponding to the same dataset as the main window.
We still have the persistence of the previous dataset on the main window:
meas_ctrl.settables([device.amp_0, device.amp_1])
meas_ctrl.setpoints_grid([np.linspace(0, 1, 20), np.linspace(0, 0.5, 15)])
meas_ctrl.gettables(device.adc)
dset = meas_ctrl.run("ADC scan 2D")

plotmon.main_QtPlot
plotmon.secondary_QtPlot
Starting iterative measurement...

  0% completed | elapsed time:      0s | time left:     25s
  0% completed | elapsed time:      0s | time left:     25s
100% completed | elapsed time:      0s | time left:      0s

100% completed | elapsed time:      0s | time left:      0s
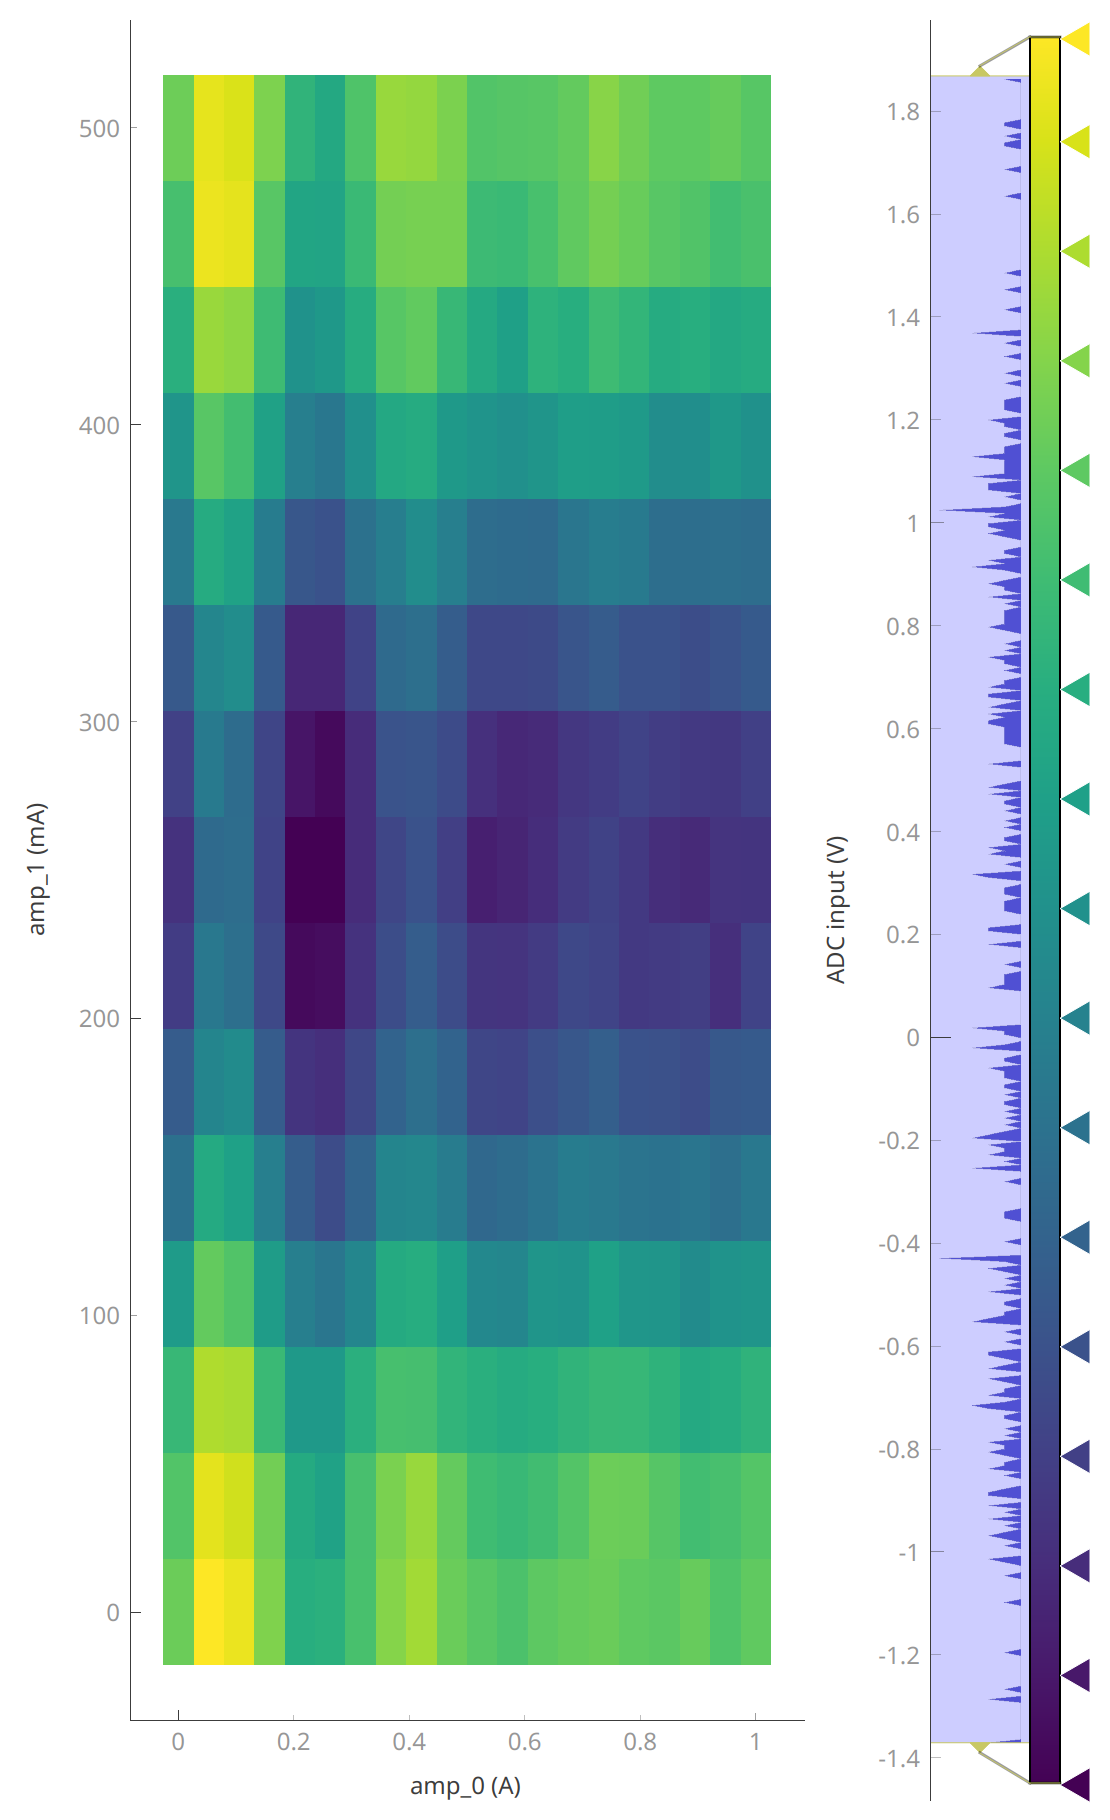
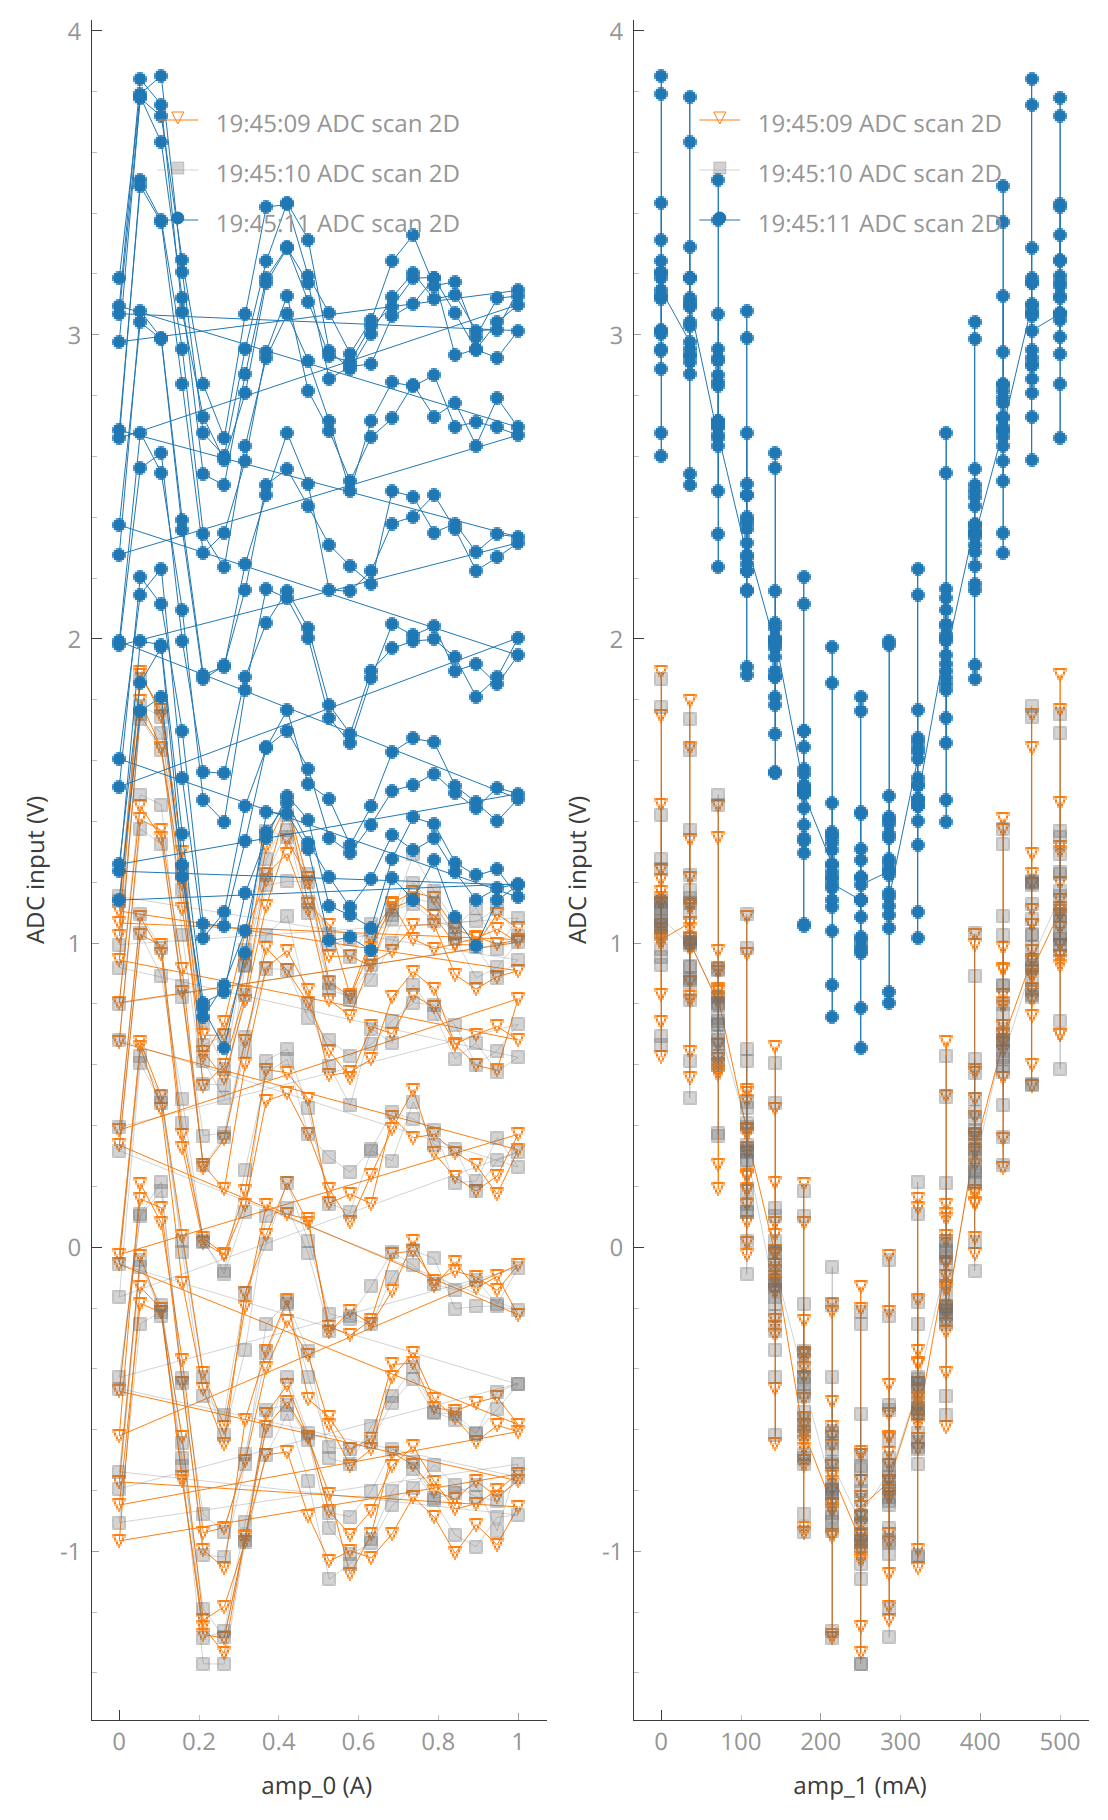
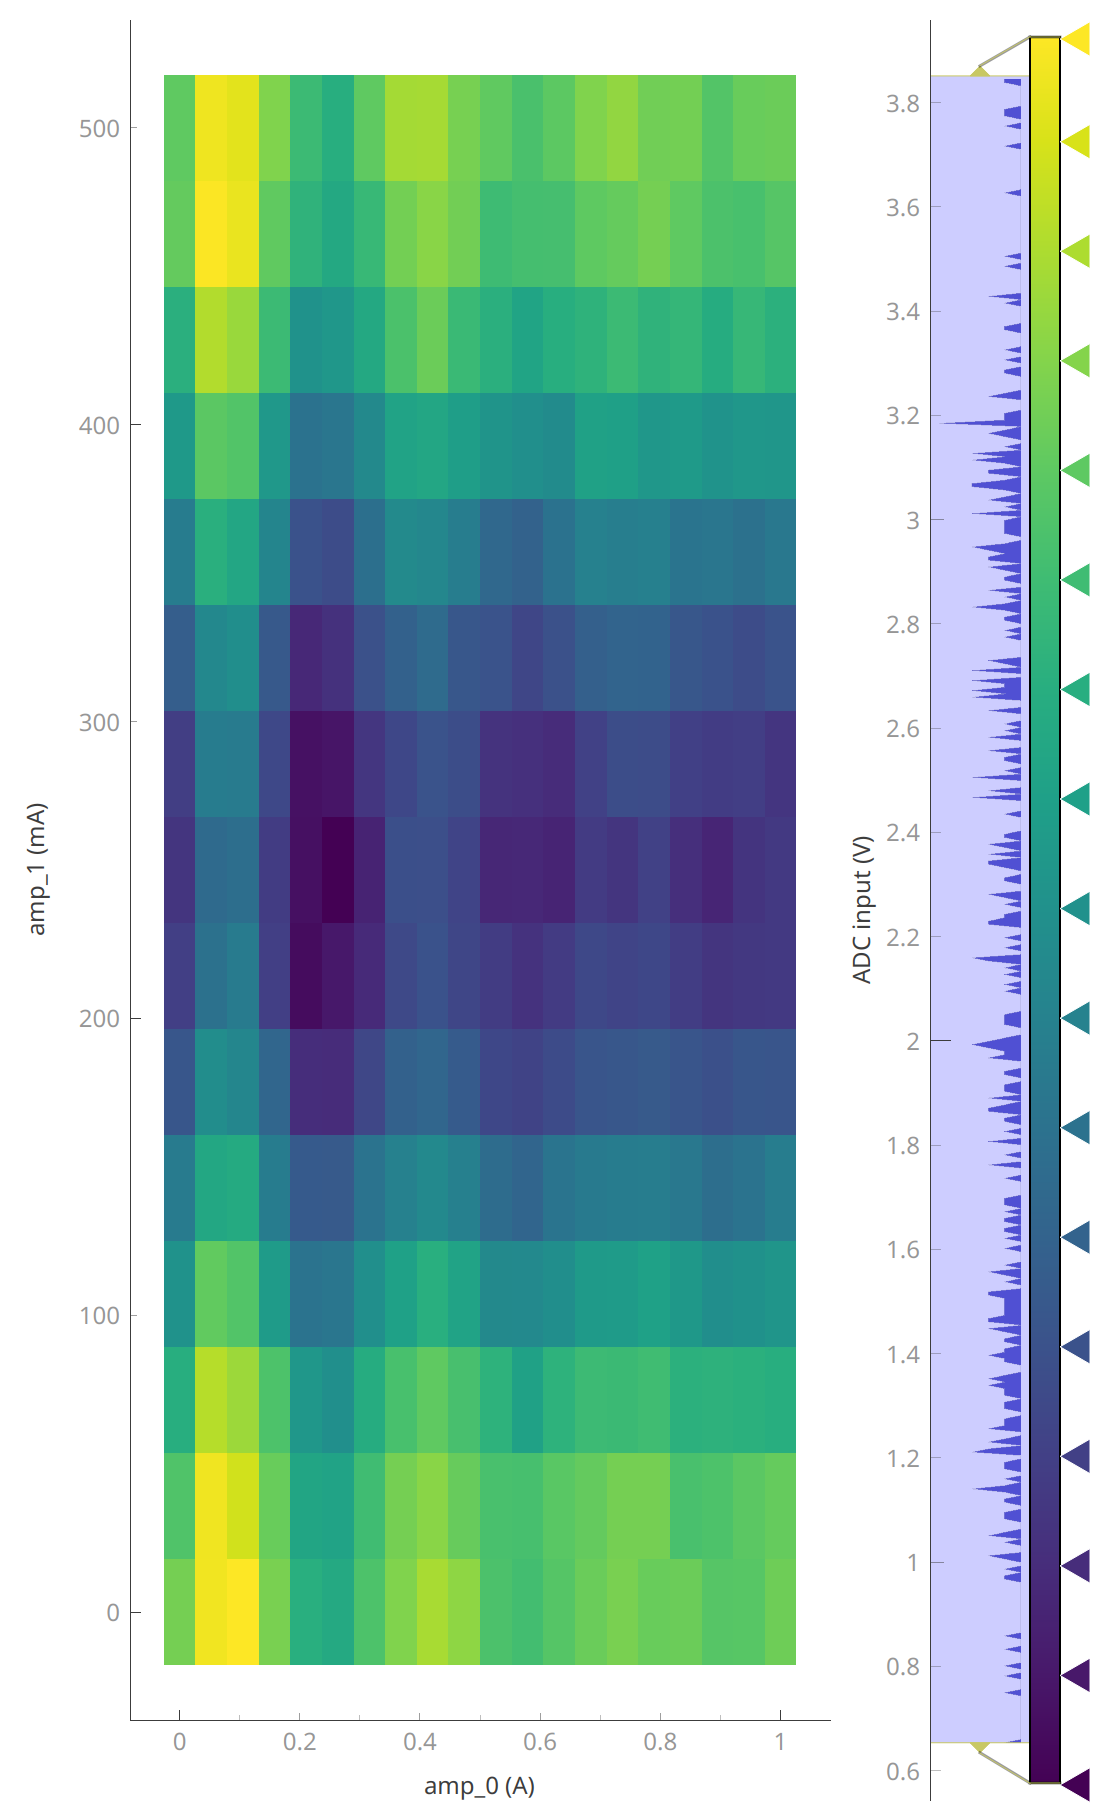
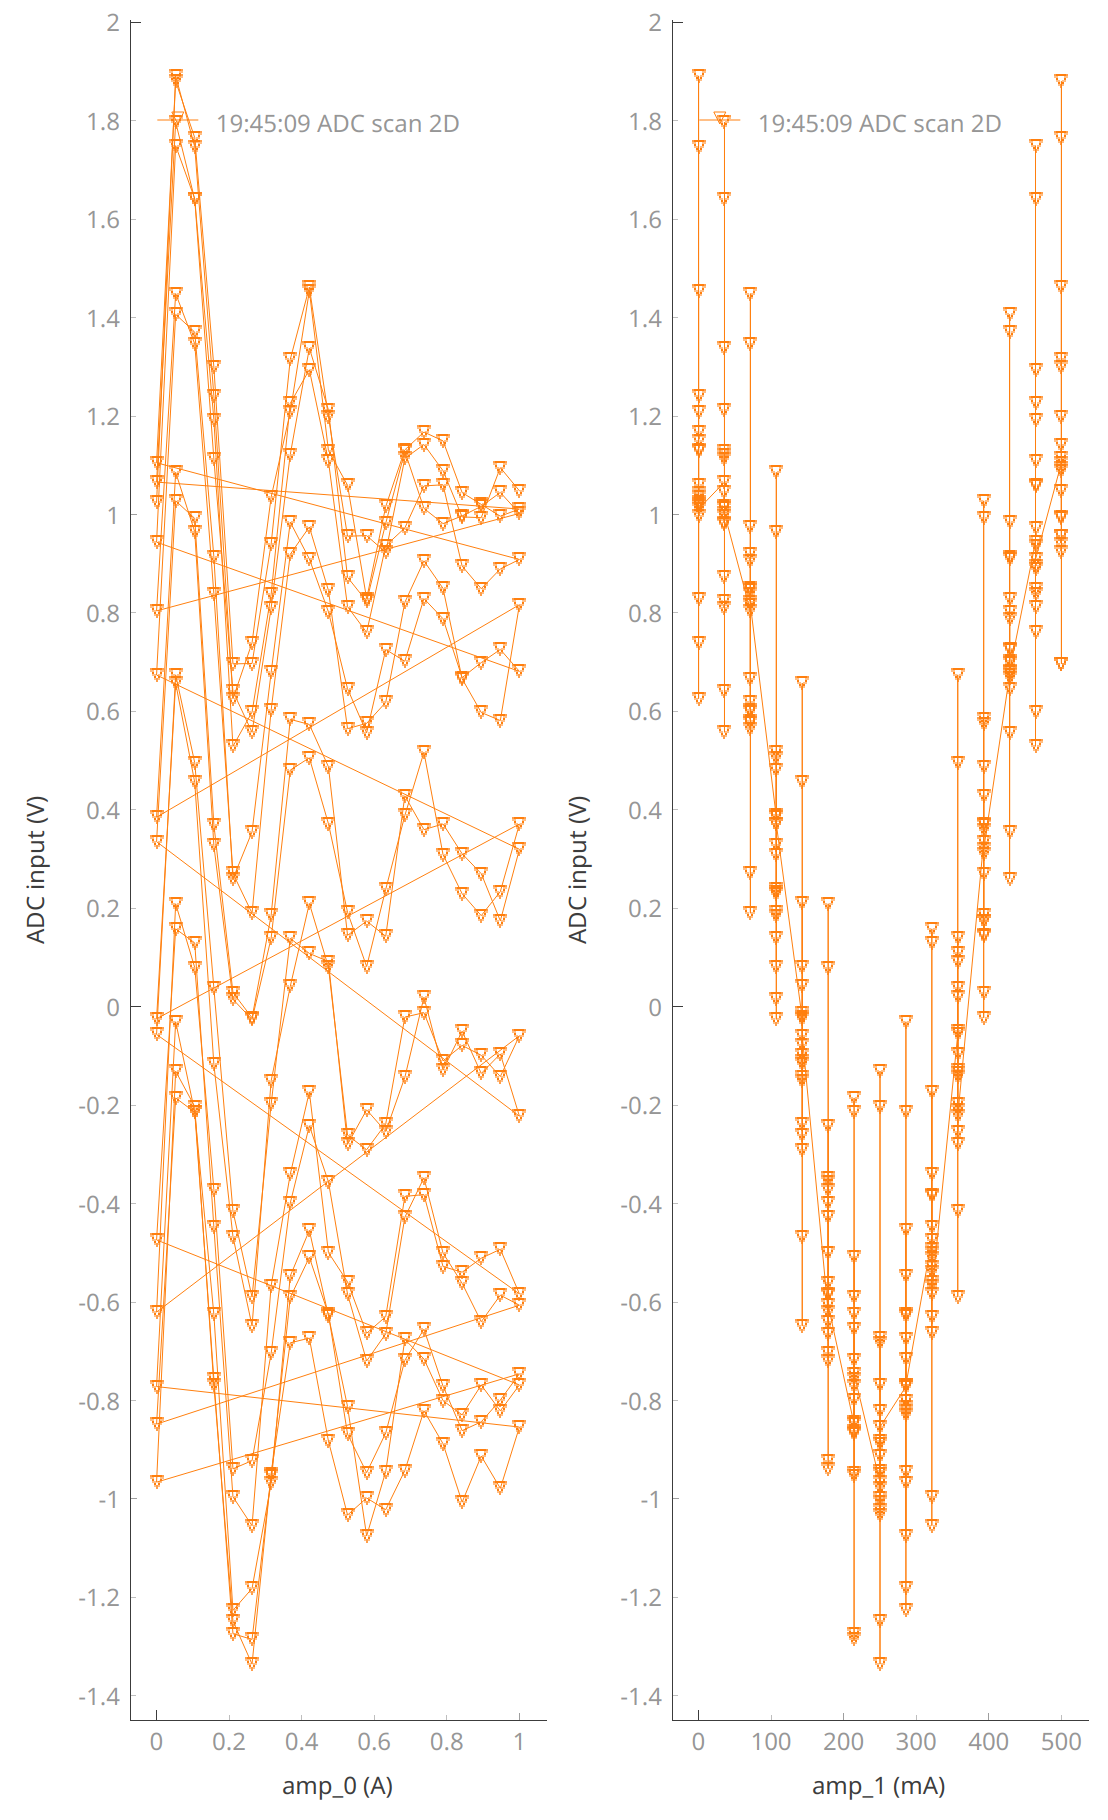
We can still have a permanent dataset as a reference in the main window:
device.offset(2.03)
plotmon.tuids_extra([reference_tuid_2D])

meas_ctrl.settables([device.amp_0, device.amp_1])
meas_ctrl.setpoints_grid([np.linspace(0, 1, 20), np.linspace(0, 0.5, 15)])
meas_ctrl.gettables(device.adc)
dset = meas_ctrl.run("ADC scan 2D")

plotmon.main_QtPlot
plotmon.secondary_QtPlot
Starting iterative measurement...

  0% completed | elapsed time:      0s | time left:     82s
  0% completed | elapsed time:      0s | time left:     82s
100% completed | elapsed time:      0s | time left:      0s

100% completed | elapsed time:      0s | time left:      0s
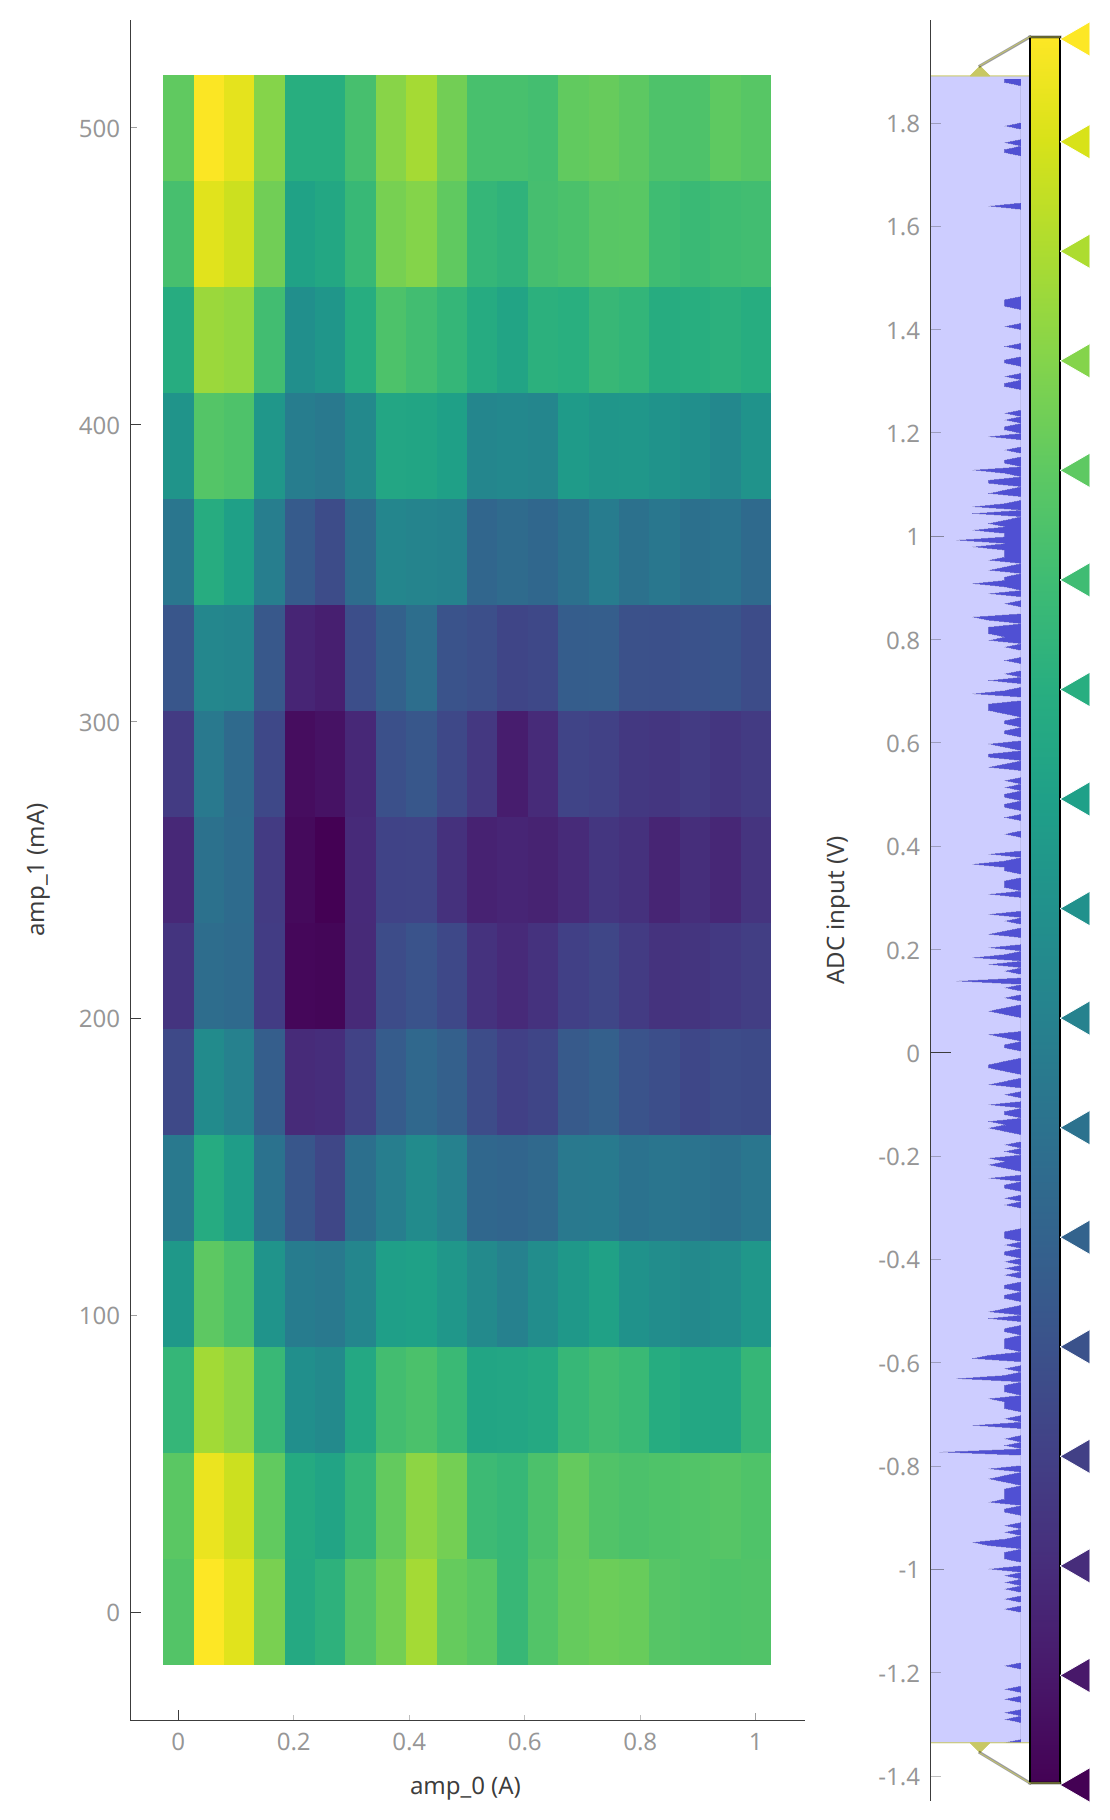
But if we want to see the 2D plot we need to reset plotmon.tuids.
plotmon.tuids([])
plotmon.tuids_extra([reference_tuid_2D])
plotmon.main_QtPlot
plotmon.secondary_QtPlot
plotmon.tuids()
[]
Now your life will never be the same again ;)