Analysis helpers#
Calibration points autodetection#
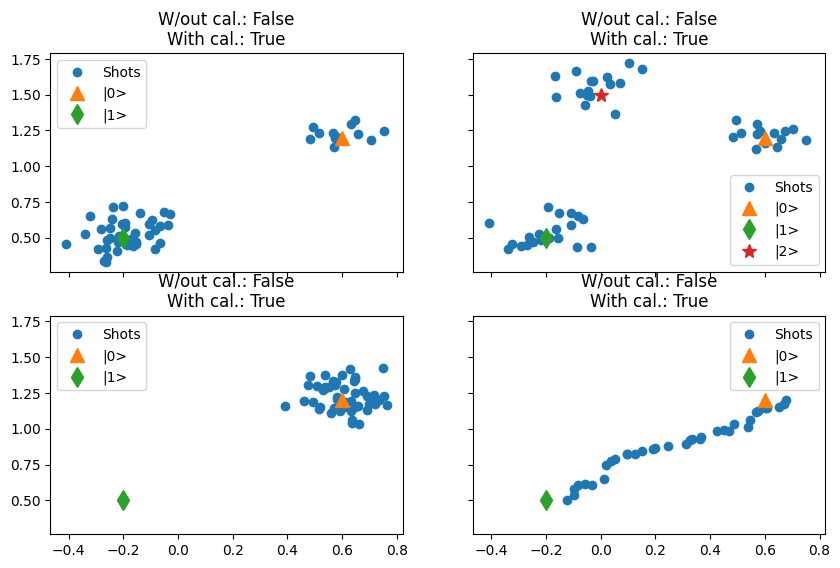
In this ideal scenario, if the datapoints indicated by the indices correspond to the calibration points, then these points will be located on the extremities of a “segment” on the IQ plane.
import matplotlib.pyplot as plt
import numpy as np

from quantify_core.analysis.calibration import has_calibration_points
from quantify_core.utilities.examples_support import mk_iq_shots


def _with_cal(data_):
    return np.concatenate((data_, (center_0, center_1)))


def _print(ax_, data_):
    ax_.set_title(
        f"W/out cal.: {has_calibration_points(data_)}\n"
        f"With cal.: {has_calibration_points(_with_cal(data_))}"
    )


fig, ((ax0, ax1), (ax2, ax3)) = plt.subplots(
    2, 2, figsize=(10, 10 / 1.6), sharex=True, sharey=True
)

center_0, center_1, center_2 = 0.6 + 1.2j, -0.2 + 0.5j, 0 + 1.5j
NUM_SHOTS = 50

data = mk_iq_shots(
    NUM_SHOTS,
    sigmas=[0.1] * 2,
    centers=(center_0, center_1),
    probabilities=[0.3, 1 - 0.3],
)

ax0.plot(data.real, data.imag, "o", label="Shots")
_print(ax0, data)

data = mk_iq_shots(
    NUM_SHOTS,
    sigmas=[0.1] * 3,
    centers=(center_0, center_1, center_2),
    probabilities=[0.35, 0.35, 1 - 0.35 - 0.35],
)
ax1.plot(data.real, data.imag, "o", label="Shots")
_print(ax1, data)

data = mk_iq_shots(
    NUM_SHOTS,
    sigmas=[0.1],
    centers=(center_0,),
    probabilities=[1],
)
ax2.plot(data.real, data.imag, "o", label="Shots")
_print(ax2, data)

data = np.fromiter(
    (
        mk_iq_shots(
            NUM_SHOTS * 2,
            sigmas=[0.5] * 2,
            centers=(center_0, center_1),
            probabilities=[prob, 1 - prob],
        ).mean()
        for prob in np.linspace(0, 1, 35)
    ),
    dtype=complex,
)
ax3.plot(data.real, data.imag, "o", label="Shots")
_print(ax3, data)

for i, ax in enumerate(fig.axes):
    ax.plot(center_0.real, center_0.imag, "^", label="|0>", markersize=10)
    ax.plot(center_1.real, center_1.imag, "d", label="|1>", markersize=10)
    if i == 1:
        ax.plot(
            center_2.real, center_2.imag, "*", label="|2>", markersize=10
        )
    ax.legend()
/tmp/ipykernel_461/1892167092.py:4: DeprecationWarning: This package has reached its end of life. It is no longer maintained and will not receive any further updates or support. For further developments, please refer to the new Quantify repository: https://gitlab.com/quantify-os/quantify.All existing functionalities can be accessed via the new Quantify repository.
  from quantify_core.analysis.calibration import has_calibration_points
