Visualization#
Using cyclic colormaps#
import matplotlib.pyplot as plt
import numpy as np
import xarray as xr
from quantify_core.visualization.mpl_plotting import set_cyclic_colormap
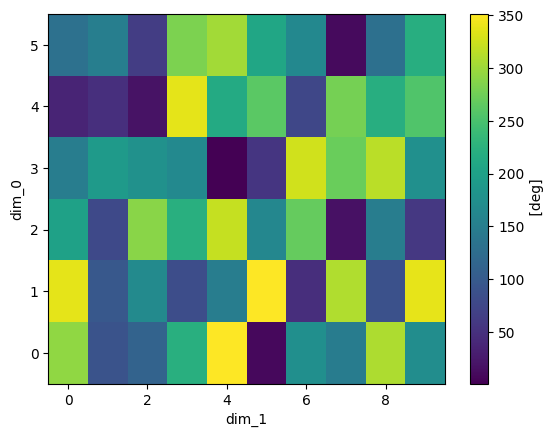
zvals = xr.DataArray(np.random.rand(6, 10) * 360)
zvals.attrs["units"] = "deg"
zvals.plot()
/tmp/ipykernel_559/749435193.py:5: DeprecationWarning: This package has reached its end of life. It is no longer maintained and will not receive any further updates or support. For further developments, please refer to the new Quantify repository: https://gitlab.com/quantify-os/quantify.All existing functionalities can be accessed via the new Quantify repository.
  from quantify_core.visualization.mpl_plotting import set_cyclic_colormap
<matplotlib.collections.QuadMesh at 0x79a9253ecc70>
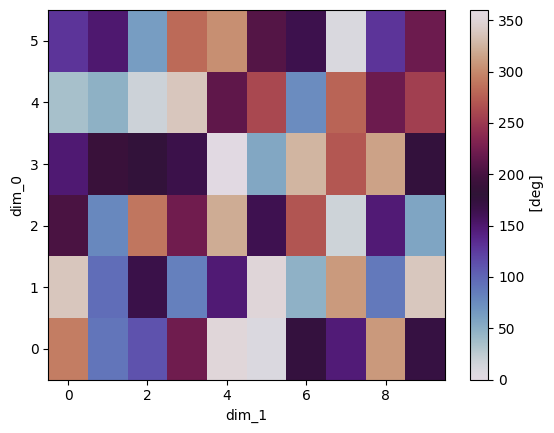
fig, ax = plt.subplots(1, 1)
color_plot = zvals.plot(ax=ax)
set_cyclic_colormap(color_plot)
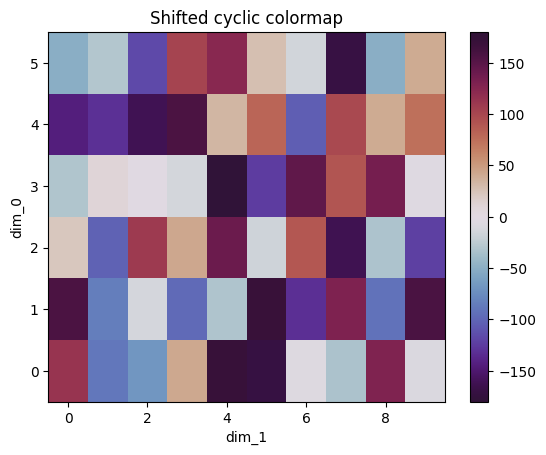
zvals_shifted = zvals - 180

fig, ax = plt.subplots(1, 1)
color_plot = zvals_shifted.plot(ax=ax)
ax.set_title("Shifted cyclic colormap")
set_cyclic_colormap(color_plot, shifted=zvals_shifted.min() < 0)
fig, ax = plt.subplots(1, 1)
color_plot = (zvals / 2).plot(ax=ax)
ax.set_title("Overwrite clim")
set_cyclic_colormap(color_plot, clim=(0, 180), unit="deg")

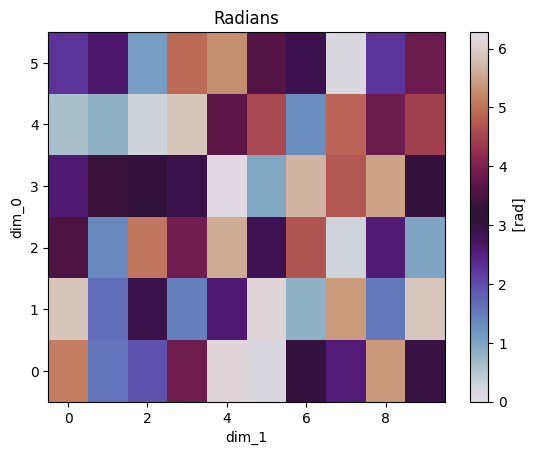
fig, ax = plt.subplots(1, 1)
zvals_rad = zvals / 180 * np.pi
zvals_rad.attrs["units"] = "rad"
color_plot = zvals_rad.plot(ax=ax)
ax.set_title("Radians")
set_cyclic_colormap(color_plot, unit=zvals_rad.units)
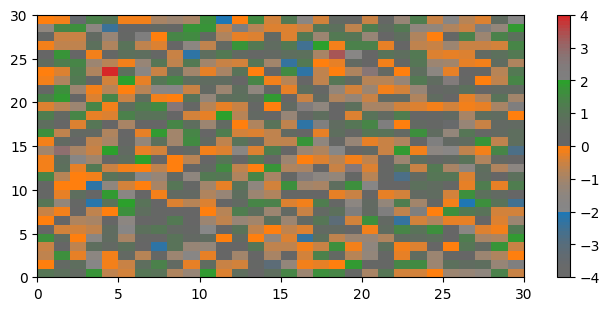
Creating custom colormaps#
In this example we use this function to create a custom colormap using several base colors for which we adjust the saturation and transparency (alpha, only visible when exporting the image).
import colorsys

import matplotlib.colors as mplc
import matplotlib.pyplot as plt
import numpy as np

from quantify_core.visualization.color_utilities import set_hlsa

color_cycle = ["#1f77b4", "#ff7f0e", "#2ca02c", "#d62728"]
all_colors = []
for col in color_cycle:
    hls = colorsys.rgb_to_hls(*mplc.to_rgb(mplc.to_rgb(col)))
    sat_vals = (np.linspace(0.0, 1.0, 20) ** 2) * hls[2]
    alpha_vals = np.linspace(0.4, 1.0, 20)

    colors = [
        list(set_hlsa(col, s=s)) for s, a in zip(sat_vals, alpha_vals)
    ]
    all_colors += colors

cmap = mplc.ListedColormap(all_colors)

np.random.seed(19680801)
data = np.random.randn(30, 30)

fig, ax = plt.subplots(1, 1, figsize=(6, 3), constrained_layout=True)

psm = ax.pcolormesh(data, cmap=cmap, rasterized=True, vmin=-4, vmax=4)
fig.colorbar(psm, ax=ax)
plt.show()