Data handling#
Converting dataset coordinates from flat list to grid#
By default measurement control returnds data in a sparse format. The resulting dataset has a single dimension, and all settables and gettables share it, for example:
from pathlib import Path

import numpy as np
from qcodes import ManualParameter, Parameter, validators

from quantify_core.data.handling import set_datadir, to_gridded_dataset
from quantify_core.measurement import MeasurementControl

set_datadir(Path.home() / "quantify-data")

time_a = ManualParameter(
    name="time_a",
    label="Time A",
    unit="s",
    vals=validators.Numbers(),
    initial_value=1,
)
time_b = ManualParameter(
    name="time_b",
    label="Time B",
    unit="s",
    vals=validators.Numbers(),
    initial_value=1,
)
signal = Parameter(
    name="sig_a",
    label="Signal A",
    unit="V",
    get_cmd=lambda: np.exp(time_a()) + 0.5 * np.exp(time_b()),
)

meas_ctrl = MeasurementControl("meas_ctrl")
meas_ctrl.settables([time_a, time_b])
meas_ctrl.gettables(signal)
meas_ctrl.setpoints_grid([np.linspace(0, 5, 10), np.linspace(5, 0, 12)])
dset = meas_ctrl.run("2D-single-float-valued-settable-gettable")
dset
/tmp/ipykernel_482/435294353.py:6: DeprecationWarning: This package has reached its end of life. It is no longer maintained and will not receive any further updates or support. For further developments, please refer to the new Quantify repository: https://gitlab.com/quantify-os/quantify.All existing functionalities can be accessed via the new Quantify repository.
  from quantify_core.data.handling import set_datadir, to_gridded_dataset
Starting iterative measurement...
<xarray.Dataset> Size: 3kB
Dimensions:  (dim_0: 120)
Coordinates:
    x0       (dim_0) float64 960B 0.0 0.5556 1.111 1.667 ... 3.889 4.444 5.0
    x1       (dim_0) float64 960B 5.0 5.0 5.0 5.0 5.0 ... 0.0 0.0 0.0 0.0 0.0
Dimensions without coordinates: dim_0
Data variables:
    y0       (dim_0) float64 960B 75.21 75.95 77.24 79.5 ... 49.36 85.65 148.9
Attributes:
    tuid:                             20250904-040856-671-4d5b4e
    name:                             2D-single-float-valued-settable-gettable
    grid_2d:                          True
    grid_2d_uniformly_spaced:         True
    1d_2_settables_uniformly_spaced:  False
    xlen:                             10
ylen: 12This format is very close to COO sparse matrix, except that coordinates are not integer.
If the initial data is gridded, it is more convenient to resotre this structure in the dataset for processing.
There is a utility function quantify_core.data.handling.to_gridded_dataset() for that:
dset_grid = to_gridded_dataset(dset)
dset_grid
<xarray.Dataset> Size: 1kB
Dimensions:  (x0: 10, x1: 12)
Coordinates:
  * x0       (x0) float64 80B 0.0 0.5556 1.111 1.667 ... 3.333 3.889 4.444 5.0
  * x1       (x1) float64 96B 0.0 0.4545 0.9091 1.364 ... 3.636 4.091 4.545 5.0
Data variables:
    y0       (x0, x1) float64 960B 1.5 1.788 2.241 2.955 ... 178.3 195.5 222.6
Attributes:
    tuid:                             20250904-040856-671-4d5b4e
    name:                             2D-single-float-valued-settable-gettable
    grid_2d:                          False
    grid_2d_uniformly_spaced:         True
    1d_2_settables_uniformly_spaced:  False
    xlen:                             10
ylen: 12We see that now dataset has two dimensions (x0 and x1), that represent the initial grid for settables time_a and time_b.
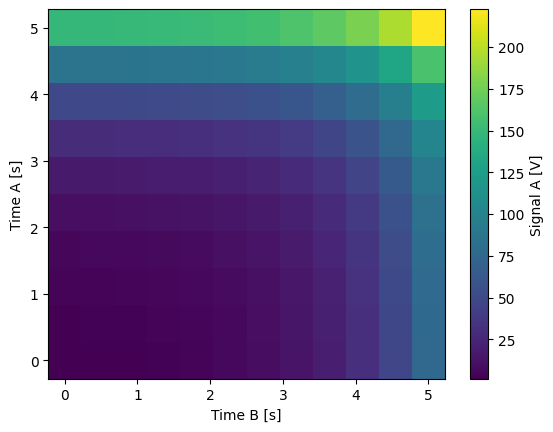
Frecuently this simplifies data processing and analysis a lot, for example, we can display the data straight away:
dset_grid.y0.plot(cmap="viridis")
<matplotlib.collections.QuadMesh at 0x7b7af992a970>