Measurement Control#
We first prepare some utilities necessarily for the examples.
from pathlib import Path

import matplotlib.pyplot as plt
import numpy as np
import xarray as xr
from qcodes import ManualParameter, Parameter

import quantify_core.data.handling as dh
from quantify_core.measurement import MeasurementControl

dh.set_datadir(Path.home() / "quantify-data")
meas_ctrl = MeasurementControl("meas_ctrl")

par0 = ManualParameter(name="x0", label="X0", unit="s")
par1 = ManualParameter(name="x1", label="X1", unit="s")
par2 = ManualParameter(name="x2", label="X2", unit="s")
par3 = ManualParameter(name="x3", label="X3", unit="s")
sig = Parameter(name="sig", label="Signal", unit="V", get_cmd=lambda: np.exp(par0()))
/tmp/ipykernel_504/4017323841.py:8: DeprecationWarning: This package has reached its end of life. It is no longer maintained and will not receive any further updates or support. For further developments, please refer to the new Quantify repository: https://gitlab.com/quantify-os/quantify.All existing functionalities can be accessed via the new Quantify repository.
  import quantify_core.data.handling as dh
Comparing iterative and batched execution loop#
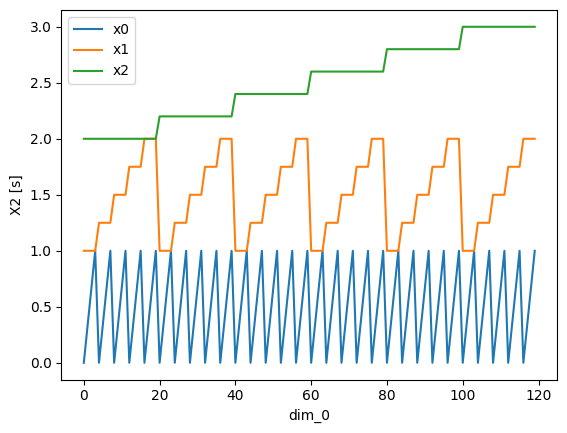
Iterative settables only#
par0.batched = False
par1.batched = False
par2.batched = False

sig.batched = False

meas_ctrl.settables([par0, par1, par2])
meas_ctrl.setpoints_grid(
    [
        np.linspace(0, 1, 4),
        np.linspace(1, 2, 5),
        np.linspace(2, 3, 6),
    ]
)
meas_ctrl.gettables(sig)
dset = meas_ctrl.run("demo")
list(xr.plot.line(xi, label=name) for name, xi in dset.coords.items())
plt.gca().legend()
Starting iterative measurement...
<matplotlib.legend.Legend at 0x79923e7da460>

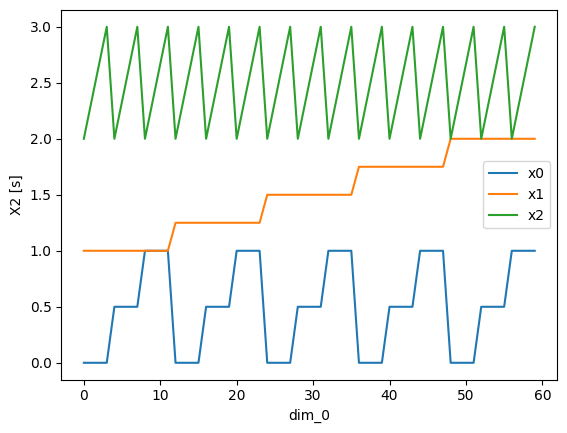
Batched settables only#
Note that the settable with lowest .batch_size will be correspond to the innermost loop.
par0.batched = True
par0.batch_size = 8
par1.batched = True
par1.batch_size = 8
par2.batched = True
par2.batch_size = 4

sig = Parameter(name="sig", label="Signal", unit="V", get_cmd=lambda: np.exp(par2()))
sig.batched = True
sig.batch_size = 32

meas_ctrl.settables([par0, par1, par2])
meas_ctrl.setpoints_grid(
    [
        np.linspace(0, 1, 3),
        np.linspace(1, 2, 5),
        np.linspace(2, 3, 4),
    ]
)
meas_ctrl.gettables(sig)
dset = meas_ctrl.run("demo")
list(xr.plot.line(xi, label=name) for name, xi in dset.coords.items())
plt.gca().legend()
Starting batched measurement...
Iterative settable(s) [outer loop(s)]:
	 --- (None) ---
Batched settable(s):
	 x0, x1, x2
Batch size limit: 4
<matplotlib.legend.Legend at 0x79923f68ae20>

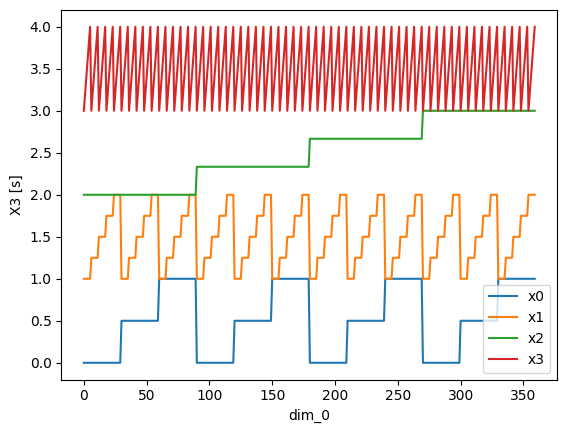
Mixed batched and iterative settables#
Note that the settable with lowest .batch_size will be correspond to the innermost loop.
Furthermore, the iterative settables will be the outermost loops.
par0.batched = False
par1.batched = True
par1.batch_size = 8
par2.batched = False
par3.batched = True
par3.batch_size = 4

sig = Parameter(name="sig", label="Signal", unit="V", get_cmd=lambda: np.exp(par3()))
sig.batched = True
sig.batch_size = 32

meas_ctrl.settables([par0, par1, par2, par3])
meas_ctrl.setpoints_grid(
    [
        np.linspace(0, 1, 3),
        np.linspace(1, 2, 5),
        np.linspace(2, 3, 4),
        np.linspace(3, 4, 6),
    ]
)
meas_ctrl.gettables(sig)
dset = meas_ctrl.run("demo")
list(xr.plot.line(xi, label=name) for name, xi in dset.coords.items())
plt.gca().legend()
Starting batched measurement...
Iterative settable(s) [outer loop(s)]:
	 x0, x2
Batched settable(s):
	 x1, x3
Batch size limit: 4
<matplotlib.legend.Legend at 0x79923de340a0>

Instrument Monitor#
You can instantiate an instrument monitor in the following way:
from quantify_core.measurement import MeasurementControl
from quantify_core.visualization import InstrumentMonitor

instrument_monitor = InstrumentMonitor("instrument_monitor")
# Set True if you want to query the instruments about each parameter
# before updating the window. Can be slow due to communication overhead.
instrument_monitor.update_snapshot(False)